Product Images Tizanidine

View Photos of Packaging, Labels & Appearance

Product Label Images

The following 5 images provide visual information about the product associated with Tizanidine NDC 50436-6755 by Unit Dose Services, such as packaging, labeling, and the appearance of the drug itself. This resource could be helpful for medical professionals, pharmacists, and patients seeking to verify medication information and ensure they have the correct product.

fig1 - fig1

fig1 - fig1

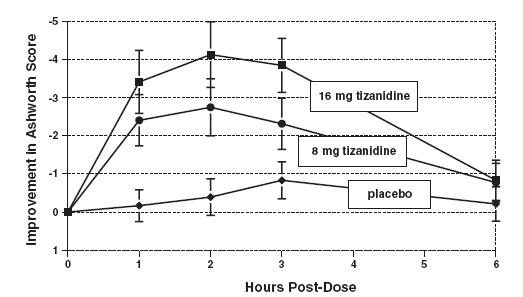
This is a chart that shows the plasma concentration of Tzanidine in ng/mL over time after taking two different forms of the medication (tablets and capsules) with and without food. There are no additional details provided in the text.*

fig2 - fig2

fig2 - fig2

The text is showing a graph with the title "Improvement in Ashworth Score". There are two plots on the graph, one labeled "16 mg tizanidine" and the other labeled "placebo". The x-axis is labeled "Hours Post-Dose". Unfortunately, there is no further information on what this graph represents or the context in which it was created.*

fig3 - fig3

fig3 - fig3

The text describes a study assessing the improvement in Ashworth Score for patients that were administered a mean dose of 28.6mg of Zanidine at both week 3 and week 7 during maintenance endpoint. The study utilized a Last Observation Garred Forward approach.*

Label Image - lbl504366755

Label Image - lbl504366755

This is a warning label for a medication called Tizanidine. The label provides information on the manufacturer, National Drug Code, lot number, expiration date, and dosage of the medication. It also includes a warning message.*

structure - structure

structure - structure

* The product label images have been analyzed using a combination of traditional computing and machine learning techniques. It should be noted that the descriptions provided may not be entirely accurate as they are experimental in nature. Use the information in this page at your own discretion and risk.