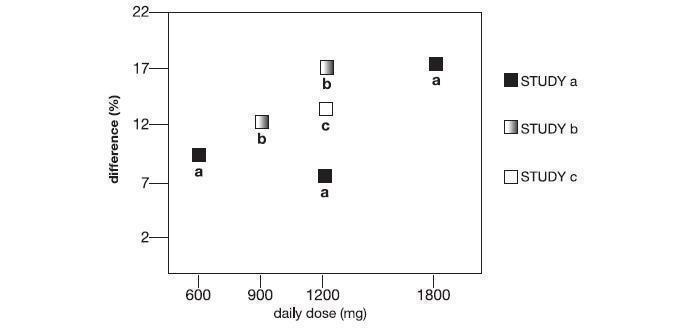
Fig1-2-3 (Fig123)
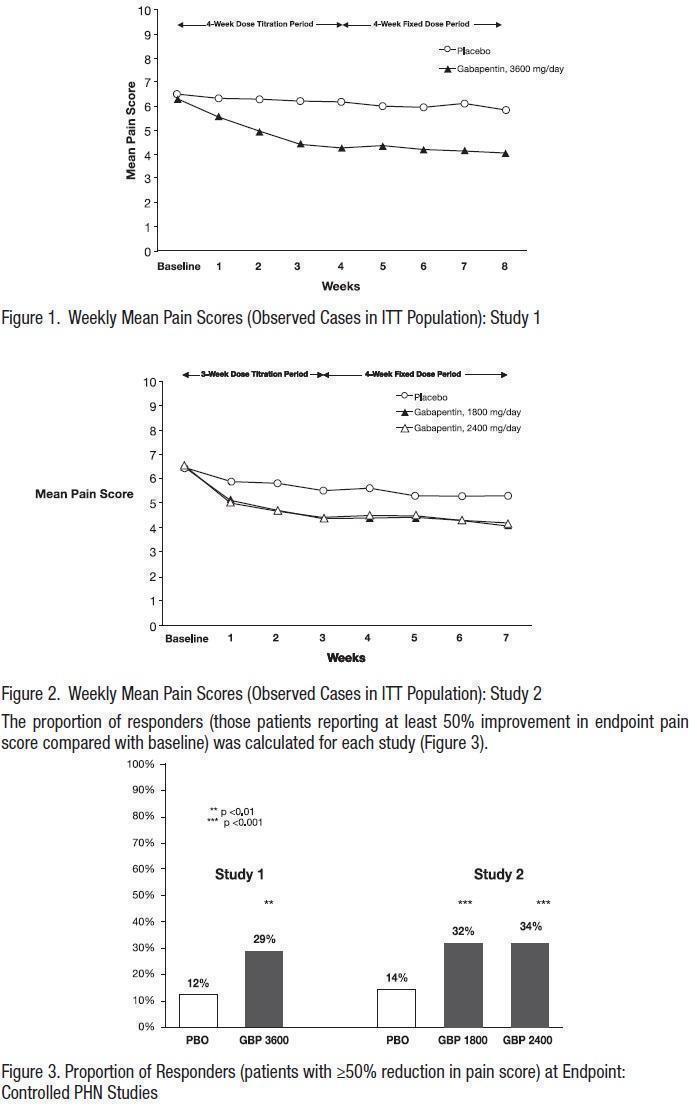
The text describes the weekly mean pain scores observed in two studies (Study 1 and Study 2), with baseline and pain scores indicated in Figure 1 and Figure 2. The proportion of responders who reported at least 50% improvement in endpoint pain score compared to baseline was also calculated, with results presented in Figure 3. The studies involved the use of medications such as L & Gabaparii, Gabapartin, and Controlled PHN Studies.*