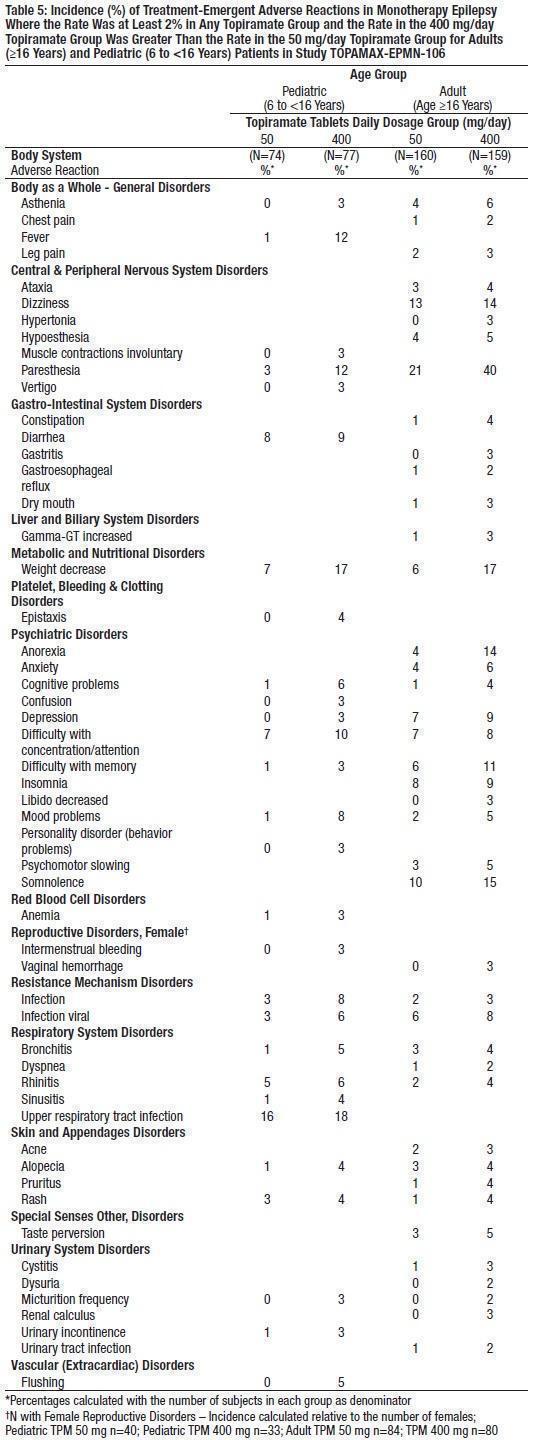
Fig1 (Fig1)

The text is an image containing a graph labeled "Figure 1: Kaplan-Meler Estimates of Cumulative Rates for Time to First Seizure". The graph compares the cumulative rates of time to first seizure for two groups: Topramate 50 molday (with 234 participants) and Topramate 400 mojany (with 236 participants). The x-axis is labeled "Time (Days)" and the y-axis is labeled "Cumulative Rates for 1st Seizure". There are no useful descriptions obtained from the text.*