Isosorbide Dinitrate And Hydralazine Hydrochloride Tablet
Product Images NDC 50742-246

View Photos of Packaging, Regulatory Labels, and Product Appearance

Product Visual Gallery

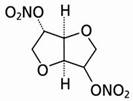
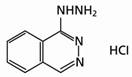
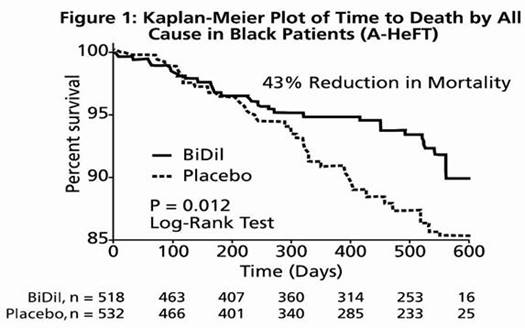
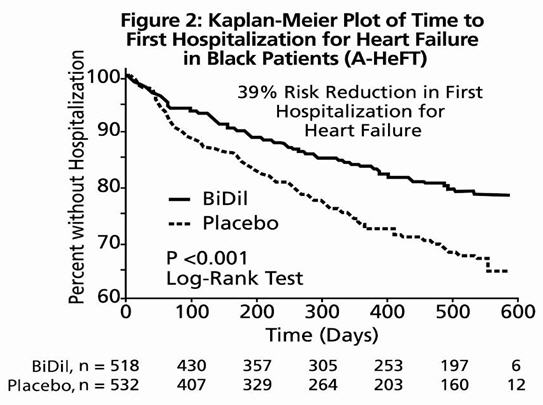
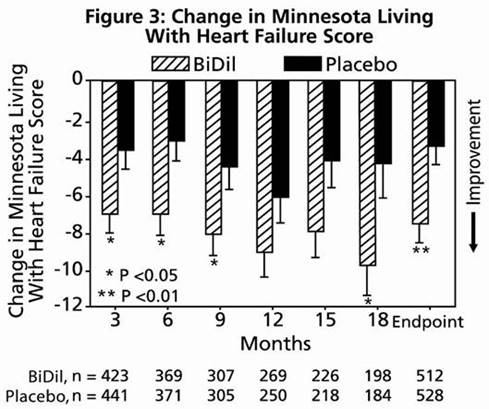
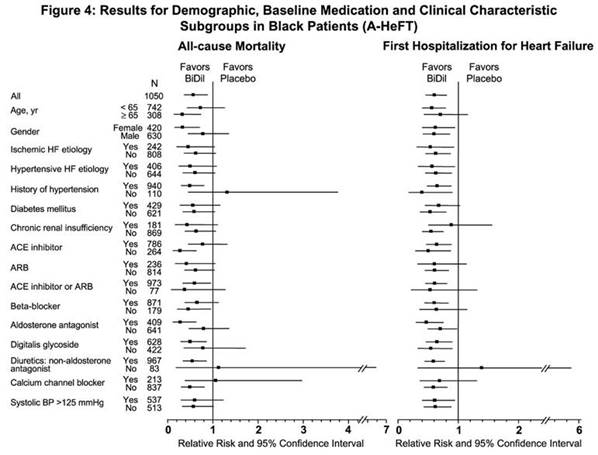
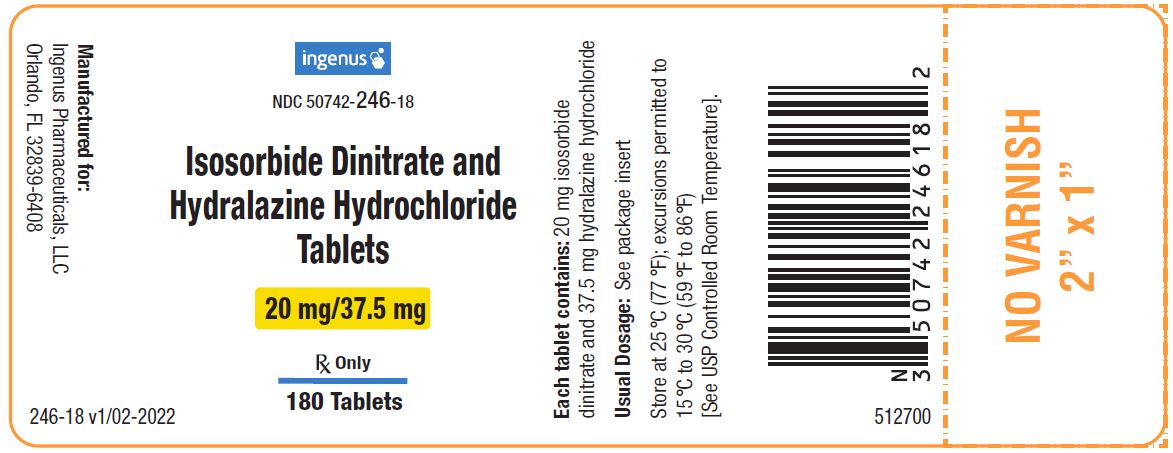
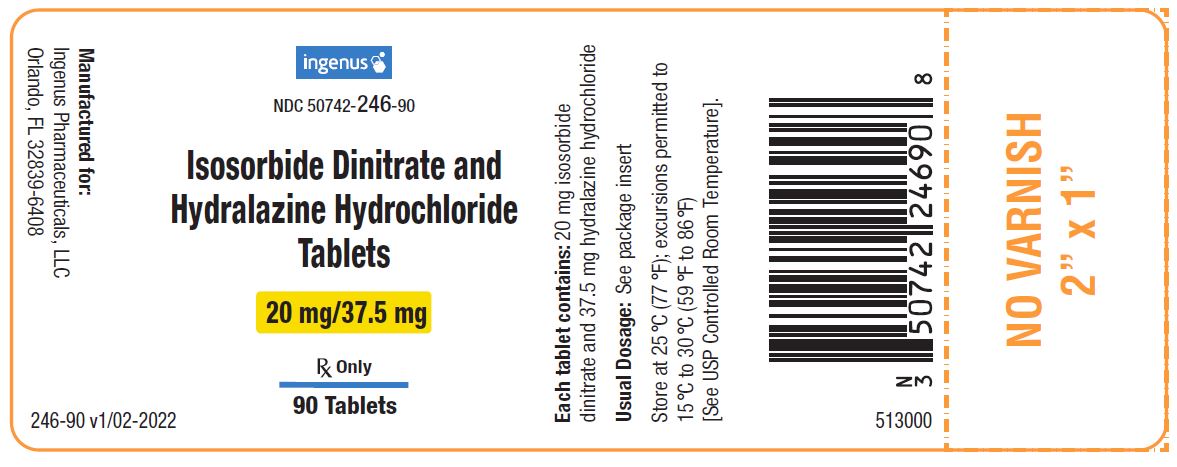
This gallery contains 9 technical images submitted to the FDA as part of the official labeling for Isosorbide Dinitrate And Hydralazine Hydrochloride (NDC 50742-246). Unlike standard consumer photos, these assets often include clinical data figures, molecular chemical structures, and official manufacturer packaging layouts.

As provided by Ingenus Pharmaceuticals, Llc, these visuals offer a comprehensive scientific overview of the product's physical and chemical identity, aiding pharmacists and researchers in product verification and study.

FDA Label Image

Image (6d0bb2ce E08c 42a3 9210 E8151fc10b57 01)

FDA Label Image

Image (6d0bb2ce E08c 42a3 9210 E8151fc10b57 02)

FDA Label Image

Image (6d0bb2ce E08c 42a3 9210 E8151fc10b57 03)

FDA Label Image

Image (6d0bb2ce E08c 42a3 9210 E8151fc10b57 04)

Image (6d0bb2ce E08c 42a3 9210 E8151fc10b57 04)
This is a figure depicting a Kaplan-Meier plot for time to first hospitalization for heart failure in black patients with data from the A-HeFT study. The plot shows a 39% risk reduction in first hospitalization for heart failure for patients taking BiDil compared to placebo. The X-axis shows time in days, and the Y-axis shows the percentage of patients without hospitalization. The legend indicates that the blue line represents BiDil and the orange line represents placebo. The plot also includes statistics indicating a P-value of <0.001 from a log-rank test.*
FDA Label Image

Image (6d0bb2ce E08c 42a3 9210 E8151fc10b57 05)

FDA Label Image

Image (6d0bb2ce E08c 42a3 9210 E8151fc10b57 06)

Image (6d0bb2ce E08c 42a3 9210 E8151fc10b57 06)
The text appears to show a figure or table (Figure 4) that displays the results of demographic, baseline medication and clinical characteristic subgroups in Black Patients (A-HeFT) for all-cause mortality and first hospitalization for heart failure. The table includes percentages and relative risks with confidence intervals for each subgroup.*
FDA Label Image

Image (6d0bb2ce E08c 42a3 9210 E8151fc10b57 07)

FDA Label Image

Bottle Label (6d0bb2ce E08c 42a3 9210 E8151fc10b57 08)

FDA Label Image

Bottle Label 90ct (6d0bb2ce E08c 42a3 9210 E8151fc10b57 09)

* These product label images have been analyzed using experimental machine learning. Please verify findings with the primary label text.