Estrogens, Conjugated Tablet, Film Coated
Product Images NDC 50742-391

View Photos of Packaging, Regulatory Labels, and Product Appearance

Product Visual Gallery

This gallery contains 12 technical images submitted to the FDA as part of the official labeling for Estrogens, Conjugated (NDC 50742-391). Unlike standard consumer photos, these assets often include clinical data figures, molecular chemical structures, and official manufacturer packaging layouts.

As provided by Ingenus Pharmaceuticals, Llc, these visuals offer a comprehensive scientific overview of the product's physical and chemical identity, aiding pharmacists and researchers in product verification and study.

FDA Label Image

0.9mg Bottle Label (0.9 mg Bottle Label)
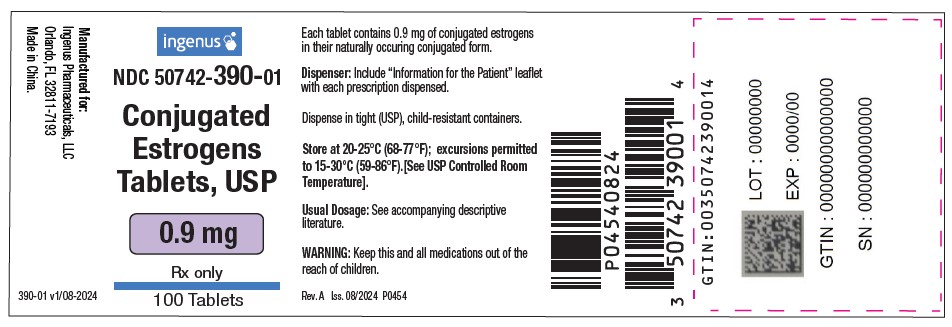
0.9mg Bottle Label (0.9 mg Bottle Label)
Label for Conjugated Estrogens Tablets, USP 0.9 mg by Ingenus Pharmaceuticals, LLC. This film-coated tablet package contains 100 tablets, prescription only, with storage instructions and dispensing information. The label includes the NDC 50742-390-01 and states the product is made in China.*
FDA Label Image

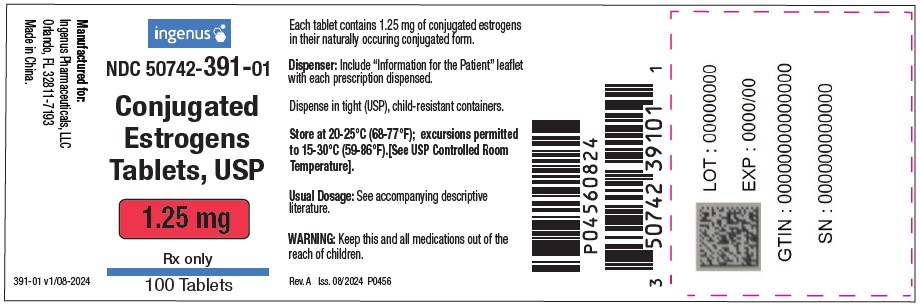
1.25mg Bottle Label (1.25 mg Bottle Label)

1.25mg Bottle Label (1.25 mg Bottle Label)
The label for Conjugated Estrogens Tablets, USP 1.25 mg by Ingenus Pharmaceuticals, LLC. It indicates a film-coated oral tablet, with 100 tablets per container. Storage conditions and dispensing instructions are provided, along with warnings to keep medication out of reach of children. The label includes the NDC 50742-391-01 and barcode.*
FDA Label Image

Image Description (Description)

Image Description (Description)
A data table listing tablet strengths and corresponding tablet color components for conjugated estrogens. The 0.9 mg strength is listed with no color additives (NA), while the 1.25 mg strength contains D&C Yellow #10 Aluminum Lake and FD&C Yellow #6 Aluminum Lake.*
FDA Label Image

Image Description (Dosage)

Image Description (Dosage)
A table listing conjugated estrogens tablets, USP, showing two strengths: 0.9 mg and 1.25 mg. It describes each tablet's oval biconvex shape and color (white for 0.9 mg, yellow for 1.25 mg), along with debossed markings. The 0.9 mg tablet is marked with "CT4" on one side and "NL" on the other; the 1.25 mg tablet is marked "CT5" and "NL."*
FDA Label Image

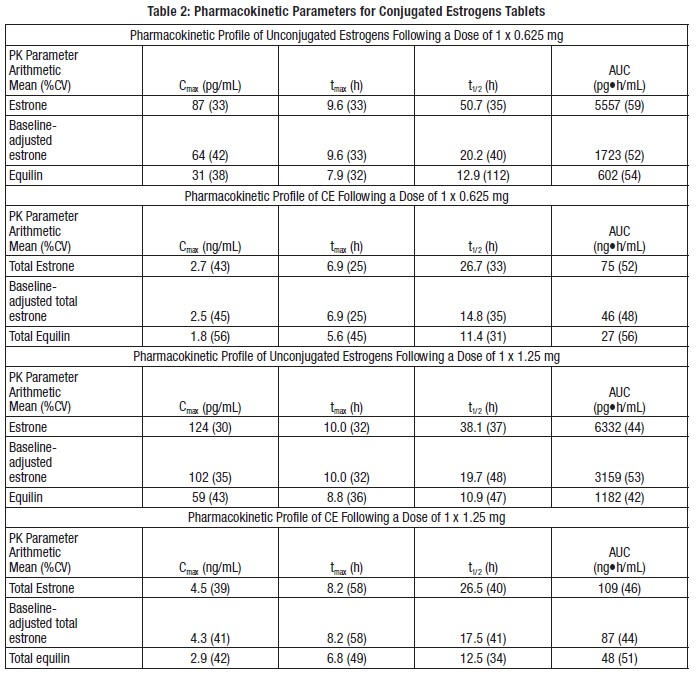
Image Description (Table 2)

Image Description (Table 2)
A data table titled 'Pharmacokinetic Parameters for Conjugated Estrogens Tablets' presenting arithmetic mean values and coefficients of variation for pharmacokinetic parameters Cmax, tmax, t1/2, and AUC. The table includes profiles of unconjugated estrogens and conjugated estrogens after doses of 0.625 mg and 1.25 mg, detailing estrone, baseline-adjusted estrone, equilin, total estrone, and total equilin concentrations.*
FDA Label Image

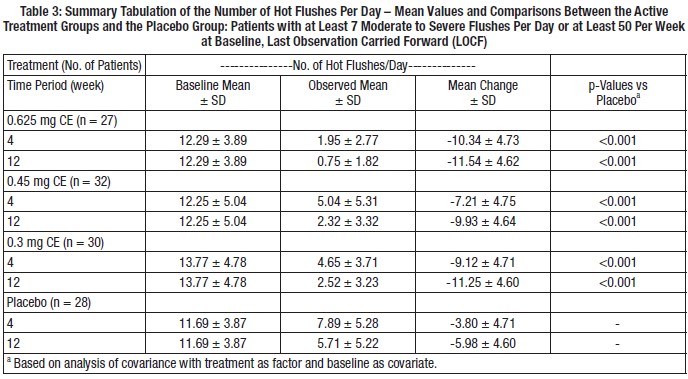
Image Description (Table 3)

Image Description (Table 3)
A data table summarizing the number of hot flushes per day as mean values with standard deviations for different treatment groups and placebo. It compares baseline, observed, and mean changes over 4 and 12 weeks for dosages of conjugated estrogens (0.625 mg, 0.45 mg, 0.3 mg) and placebo, including p-values versus placebo. The table notes Patients had at least 7 moderate to severe flushes per day or 50 per week at baseline.*
FDA Label Image

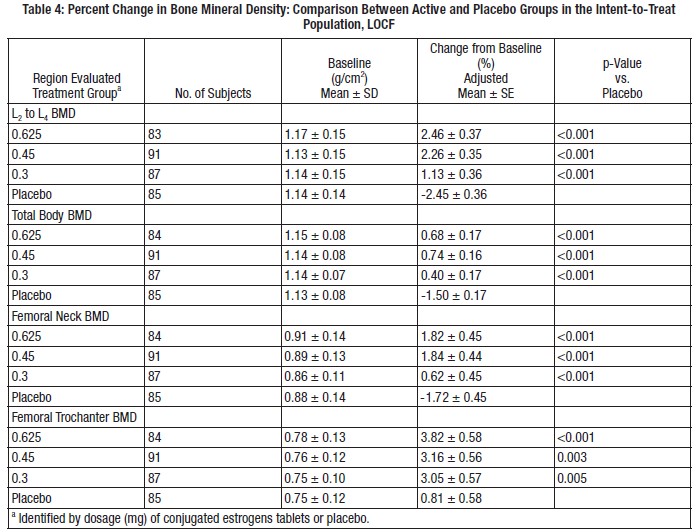
Image Description (Table 4)

Image Description (Table 4)
A data table titled 'Percent Change in Bone Mineral Density: Comparison Between Active and Placebo Groups in the Intent-to-Treat Population, LOCF.' It shows bone mineral density changes at various skeletal regions for different dosages (0.625, 0.45, 0.3 mg) of conjugated estrogens tablets versus placebo, including number of subjects, baseline values, percent change from baseline, and p-values versus placebo.*
FDA Label Image

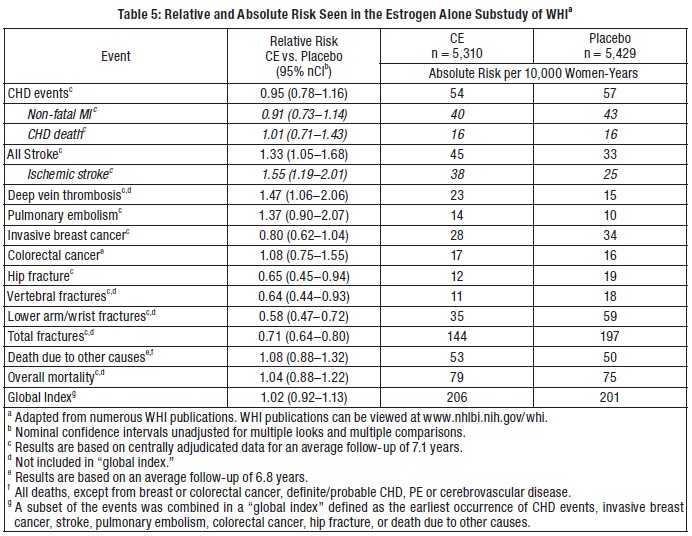
Image Description (Table 5)

Image Description (Table 5)
A data table titled 'Relative and Absolute Risk Seen in the Estrogen Alone Substudy of WHI,' presenting relative risk and absolute risk rates per 10,000 women-years for various health events comparing conjugated estrogens (CE) to placebo. The table includes cardiovascular events, strokes, cancers, fractures, and mortality outcomes with numerical risk values and confidence intervals.*
FDA Label Image

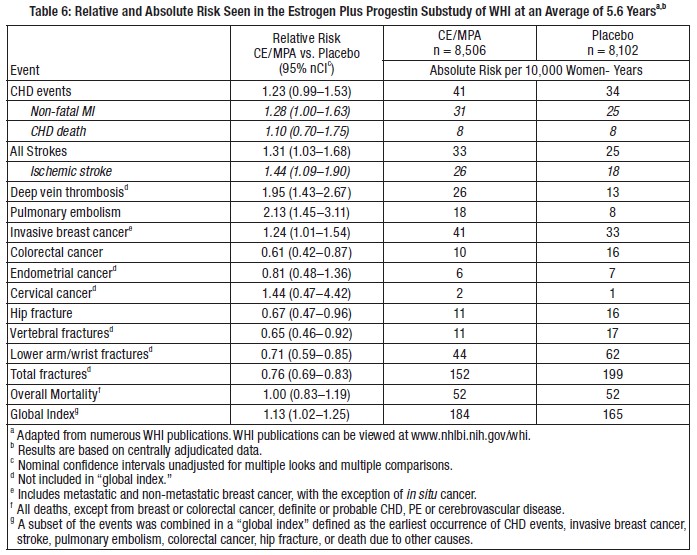
Image Description (Table 6)

Image Description (Table 6)
A table presenting relative and absolute risks observed in the Estrogen Plus Progestin Substudy of WHI over an average of 5.6 years. It compares various health events between CE/MPA treatment (n=8,506) and placebo (n=8,102), listing relative risk with confidence intervals and absolute risk per 10,000 woman-years for cardiovascular events, cancers, fractures, mortality, and a global index.*
FDA Label Image

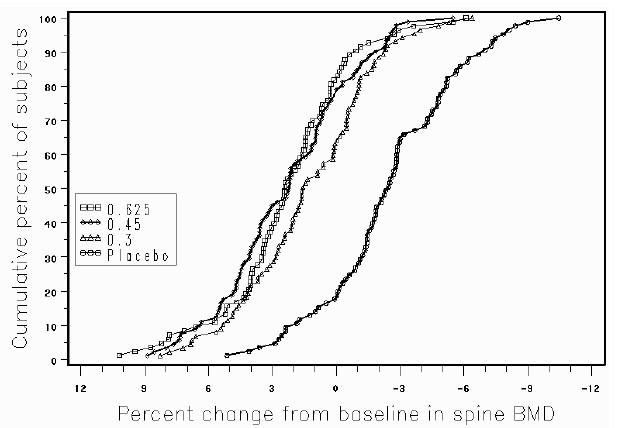
Figure1 (Figure1)

Figure1 (Figure1)
A line graph depicting the cumulative percent of subjects versus percent change from baseline in spine bone mineral density (BMD). The graph compares multiple groups labeled as 0.625, 0.45, 0.3, and Placebo, showing their BMD changes over time.*
FDA Label Image

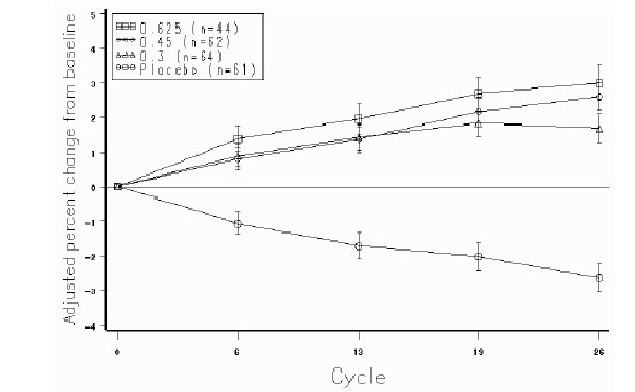
Figure2 (Figure2)

Figure2 (Figure2)
A line graph showing adjusted percent change from baseline over multiple cycles for different groups, including 0.625 mg, 0.45 mg, 0.3 mg doses, and placebo. The x-axis represents the cycle number and the y-axis shows the adjusted percent change from baseline, with error bars for each data point.*
FDA Label Image

* About these descriptions: Image descriptions on this page are generated by automated AI analysis of the product label images from the manufacturer's FDA label submission (SPL). They are provided for reference only and may contain errors or omissions. Always rely on the printed label itself and the official FDA labeling, and consult a pharmacist or healthcare professional with any questions about this product.