Metformin Tablet, Extended Release
Product Images NDC 50742-634

12 FDA label images from Ingenus Pharmaceuticals, Llc · Packaging, Regulatory Labels, and Product Appearance

Product Visual Gallery

This gallery contains 12 technical images submitted to the FDA as part of the official labeling for Metformin (NDC 50742-634). Unlike standard consumer photos, these assets often include clinical data figures, molecular chemical structures, and official manufacturer packaging layouts.

As provided by Ingenus Pharmaceuticals, Llc, these visuals offer a comprehensive scientific overview of the product's physical and chemical identity, aiding pharmacists and researchers in product verification and study.

FDA Label Image

Image-01 (Image 01)

Image-01 (Image 01)
A data table listing adverse reactions from clinical trials of Metformin HCl extended-release tablets. It compares the percentage of patients experiencing diarrhea and nausea/vomiting on Metformin (10% and 7%, respectively) versus placebo (3% and 2%, respectively) in patients with type 2 diabetes mellitus.*
FDA Label Image

Image-02 (Image 02)

Image-02 (Image 02)
A data table titled 'Clinically Significant Drug Interactions with metformin hydrochloride extended-release tablets' listing categories of interacting drugs (carbonic anhydrase inhibitors, drugs reducing tablet clearance, alcohol, insulin secretagogues/insulin, drugs affecting glycemic control) with columns for clinical impact, intervention, and examples for each category.*
FDA Label Image

Image-03 (Image 03)

Image-03 (Image 03)
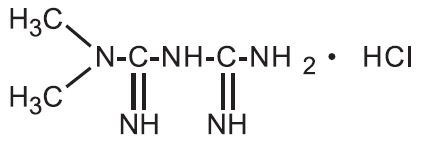
Chemical structure of metformin hydrochloride, showing its molecular arrangement including dimethyl groups and guanidine-like structure associated with the molecule.*
FDA Label Image

Image-04 (Image 04)

Image-04 (Image 04)
A data table titled 'Table 3' comparing steady-state pharmacokinetic parameters at 4 weeks between Metformin hydrochloride extended-release tablets (2,000 mg, administered once daily after dinner) and immediate-release Metformin HCl tablets (2,000 mg total, 1,000 mg twice daily). Parameters listed include AUC, Tmax, and Cmax with mean and standard deviations.*
FDA Label Image

Image-05 (Image 05)

Image-05 (Image 05)
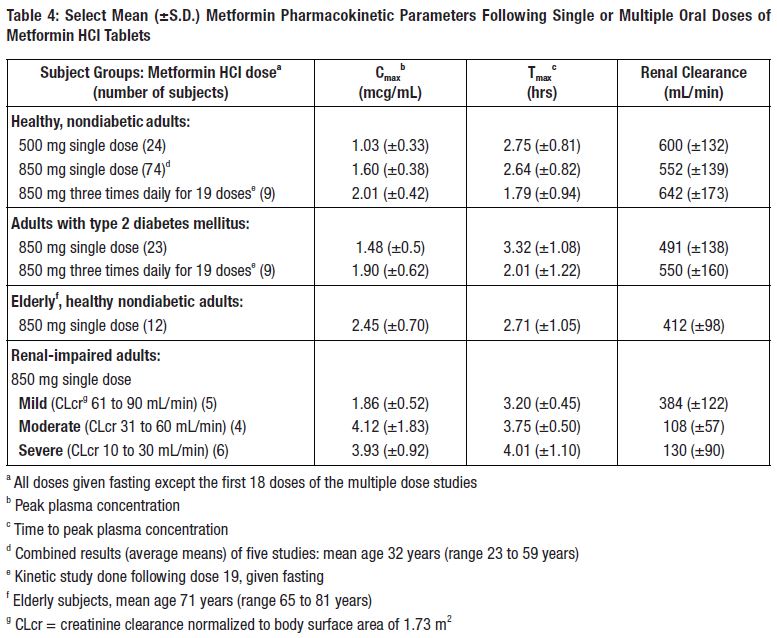
A data table titled 'Select Mean (±S.D.) Metformin Pharmacokinetic Parameters Following Single or Multiple Oral Doses of Metformin HCl Tablets' showing pharmacokinetic parameters including peak plasma concentration (Cmax), time to peak plasma concentration (Tmax), and renal clearance for various subject groups: healthy non-diabetic adults, adults with type 2 diabetes mellitus, elderly healthy non-diabetic adults, and renal-impaired adults subdivided by renal function. The table includes dose variations and number of subjects for each group.*
FDA Label Image

Image-06 (Image 06)

Image-06 (Image 06)
A data table titled 'Effect of Coadministered Drug on Plasma Metformin Systemic Exposure' showing various drugs, their doses, the dose of metformin HCl given, and the geometric mean ratio of metformin exposure (AUC and Cmax) when coadministered. The table includes sections on no dosing adjustments required, cationic drugs that may reduce metformin elimination, and carbonic anhydrase inhibitors that may cause metabolic acidosis, with specific drug names and numeric values.*
FDA Label Image

Image-07 (Image 07)

Image-07 (Image 07)
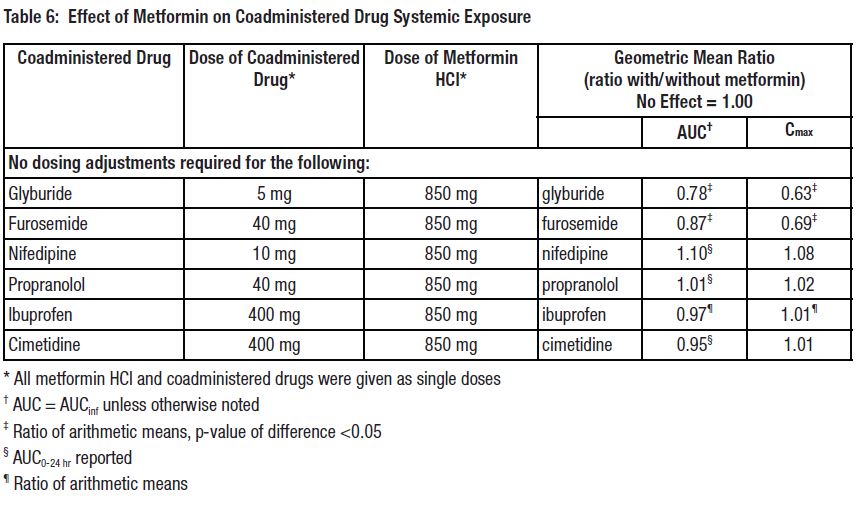
Table showing the effect of Metformin on systemic exposure of coadministered drugs. Columns list the coadministered drug, dose of drug, dose of Metformin HCl, and geometric mean ratio of pharmacokinetic parameters (AUC and Cmax) with and without Metformin. Drugs listed include Glyburide, Furosemide, Nifedipine, Propranolol, Ibuprofen, and Cimetidine with corresponding dose details and ratio data indicating no dosing adjustments needed.*
FDA Label Image

Image-08 (Image 08)

Image-08 (Image 08)
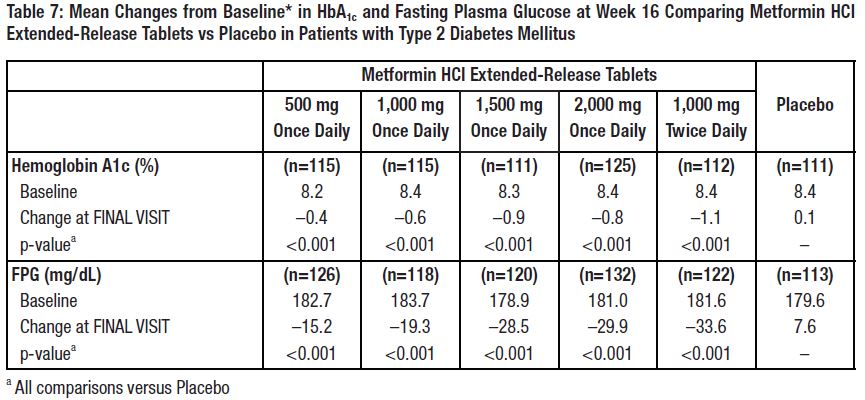
Data table showing mean changes from baseline in Hemoglobin A1c (%) and fasting plasma glucose (FPG) in mg/dL at week 16 for Metformin HCl Extended-Release Tablets at doses of 500 mg to 2,000 mg once daily and 1,000 mg twice daily compared to placebo in patients with Type 2 Diabetes Mellitus. Includes baseline values, changes at final visit, sample sizes, and p-values indicating comparisons versus placebo.*
FDA Label Image

Image-09 (Image 09)

Image-09 (Image 09)
A clinical data table comparing mean changes from baseline in Hemoglobin A1c (%) and Fasting Plasma Glucose (mg/dL) at week 24 between Metformin HCl 500 mg twice daily and Metformin HCl extended-release dosed once daily at 1,000 mg and 1,500 mg in patients with type 2 diabetes mellitus. The table shows sample sizes, baseline values, and changes at final visit with 95% confidence intervals.*
FDA Label Image

Image-10 (Image 10)

FDA Label Image

Image-11 (Image 11)

Image-11 (Image 11)
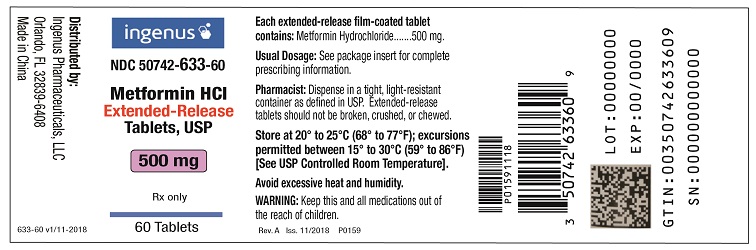
Label for Metformin HCl Extended-Release Tablets, USP, 500 mg oral tablets by Ingenus Pharmaceuticals, LLC. The label shows 60 tablets per container, NDC 50742-633-60. It includes storage instructions, pharmacist dispensing guidance, and warnings about handling and use.*
FDA Label Image

Image-12 (Image 12)

Image-12 (Image 12)
Metformin HCl Extended-Release Tablets, USP 1000 mg oral tablets by Ingenus Pharmaceuticals, LLC. The label indicates a package containing 60 extended-release tablets. It includes storage instructions, pharmacist dispensing guidelines, and a warning to keep medications out of children's reach. The label also displays NDC 50742-634-60 and batch information.*

* About these descriptions: Image descriptions on this page are generated by automated AI analysis of the product label images from the manufacturer's FDA label submission (SPL). They are provided for reference only and may contain errors or omissions. Always rely on the printed label itself and the official FDA labeling, and consult a pharmacist or healthcare professional with any questions about this product.