Estradiol And Norethindrone Acetate Tablet
Product Images NDC 50742-658

19 FDA label images from Ingenus Pharmaceuticals, Llc · Packaging, Regulatory Labels, and Product Appearance

Product Visual Gallery

This gallery contains 19 technical images submitted to the FDA as part of the official labeling for Estradiol And Norethindrone Acetate (NDC 50742-658). Unlike standard consumer photos, these assets often include clinical data figures, molecular chemical structures, and official manufacturer packaging layouts.

As provided by Ingenus Pharmaceuticals, Llc, these visuals offer a comprehensive scientific overview of the product's physical and chemical identity, aiding pharmacists and researchers in product verification and study.

FDA Label Image

Image (Image 01)

Image (Image 01)
Chemical structure of Estradiol, showing its molecular formula diagram with hydroxyl groups and steroid rings, labeled "Estradiol" below the structure.*
FDA Label Image

Image (Image 02)

Image (Image 02)
Chemical structure of norethindrone acetate, a synthetic steroidal compound shown by a multi-ring molecular diagram with labeled oxygen and acetate groups. The structure is depicted with distinct bonds and stereochemistry indicators.*
FDA Label Image

Image (Image 03)

Image (Image 03)
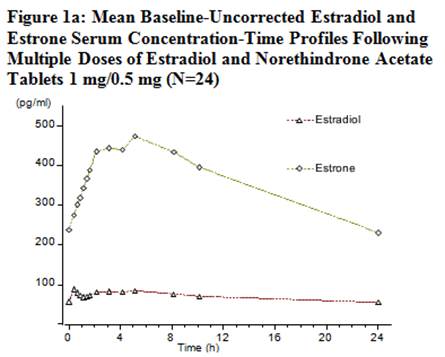
A line graph showing mean baseline-uncorrected serum concentration-time profiles for estradiol and estrone after multiple oral doses of Estradiol and Norethindrone Acetate Tablets 1 mg/0.5 mg. The x-axis represents time in hours (0 to 24), and the y-axis shows concentration in pg/ml. Estrone levels peak higher than estradiol over the observed time course.*
FDA Label Image

Image (Image 04)

Image (Image 04)
A line graph showing the mean baseline-uncorrected norethindrone serum concentration-time profile over 24 hours following multiple doses of estradiol and norethindrone acetate tablets 1 mg/0.5 mg. The y-axis represents norethindrone serum concentration in ng/ml, peaking near 7.5 ng/ml shortly after dosing, then declining over time. The x-axis shows time in hours from 0 to 24.*
FDA Label Image

Image (Image 05)

Image (Image 05)
Line graph titled 'Mean Weekly Number of Moderate and Severe Hot Flashes in a 12-Week Study' comparing placebo, 1 mg Estradiol, and Estradiol/Norethindrone Acetate tablets 1 mg/0.5 mg. The y-axis indicates the number of moderate to severe hot flashes per week, and the x-axis shows weeks from 0 to 12. Data show a decline over time for both treatments, with Estradiol/Norethindrone Acetate tablets showing the steepest decrease.*
FDA Label Image

Image (Image 06)

Image (Image 06)
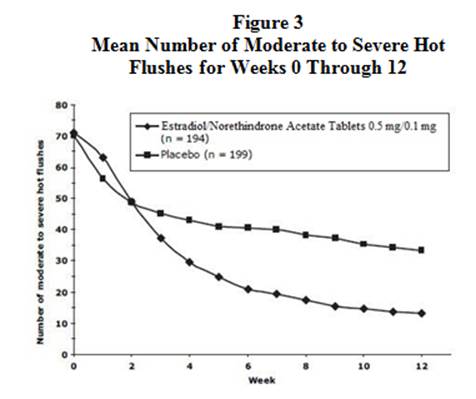
A line graph titled 'Mean Number of Moderate to Severe Hot Flushes for Weeks 0 Through 12' comparing Estradiol/Norethindrone Acetate Tablets 0.5 mg/0.1 mg versus placebo. The vertical axis shows the number of moderate to severe hot flushes from 0 to 80, while the horizontal axis represents weeks from 0 to 12. Lines indicate a decreasing trend in hot flushes with the Estradiol/Norethindrone Acetate treatment group compared to a more gradual decrease with placebo.*
FDA Label Image

Image (Image 07)

Image (Image 07)
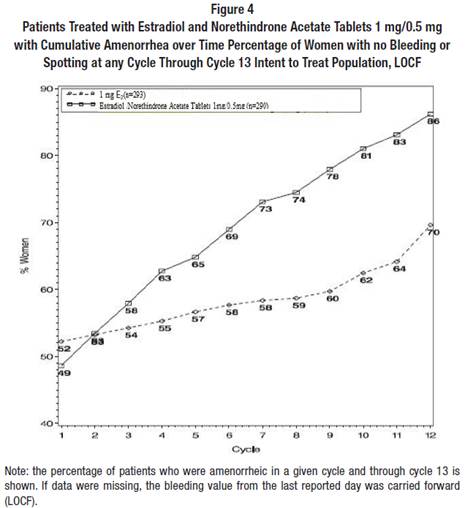
Line graph showing cumulative amenorrhea over time in women treated with Estradiol and Norethindrone Acetate Tablets 1 mg/0.5 mg and 1 mg/0.5 mg doses. The x-axis represents treatment cycles (1 to 12) and the y-axis shows percentage of women with no bleeding or spotting. Data indicates increasing percentages of amenorrhea with each cycle, reaching over 80% for 1 mg dose by cycle 12.*
FDA Label Image

Image (Image 08)

Image (Image 08)
A line graph titled 'Patients Treated with estradiol and norethindrone acetate tablets 0.5 mg/0.1 mg with Cumulative Amenorrhea over Time' showing the percentage of women with no bleeding or spotting at any cycle through cycle 6. The x-axis represents Cycle (1 to 6), and the y-axis represents Percentage of Women (40% to 100%). Two lines compare estradiol and norethindrone acetate tablets 0.5 mg/0.1 mg against placebo, indicating higher cumulative amenorrhea percentages for placebo across cycles.*
FDA Label Image

Image (Image 09)

Image (Image 09)
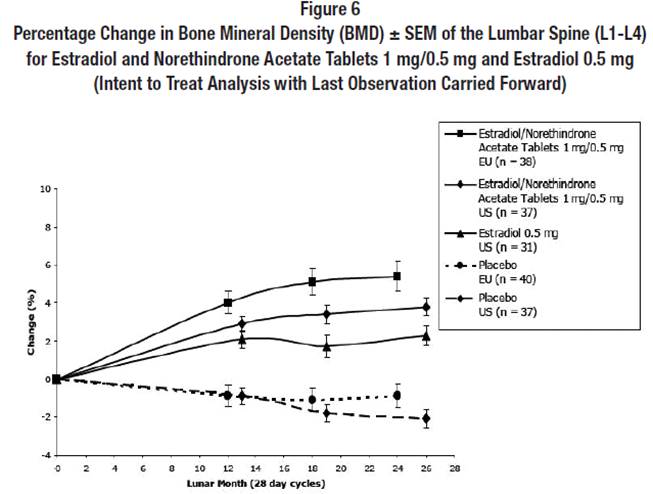
A line graph titled 'Percentage Change in Bone Mineral Density (BMD) ± SEM of the Lumbar Spine (L1-L4)' for Estradiol and Norethindrone Acetate Tablets 1 mg/0.5 mg and Estradiol 0.5 mg over 26 lunar months (28-day cycles). The graph compares groups in the EU and US taking Estradiol/Norethindrone Acetate, Estradiol alone, or placebo, showing percentage change in BMD on the y-axis and lunar months on the x-axis. Multiple lines with error bars represent the different treatment and placebo groups.*
FDA Label Image

Image (Image 10)

Image (Image 10)
A data table titled 'Relative and Absolute Risk Seen in the Estrogen Plus Progestin Substudy of WHI at an Average of 5.6 Years,' presenting relative risks and absolute risks per 10,000 women-years for various medical events such as CHD events, strokes, deep vein thrombosis, pulmonary embolism, several types of cancer, fractures, overall mortality, and a global index. The table compares CE/MPA and placebo groups, including risk ratios with 95% confidence intervals and absolute event counts for each group.*
FDA Label Image

Image (Image 11)

FDA Label Image

Image (Image 12)

Image (Image 12)
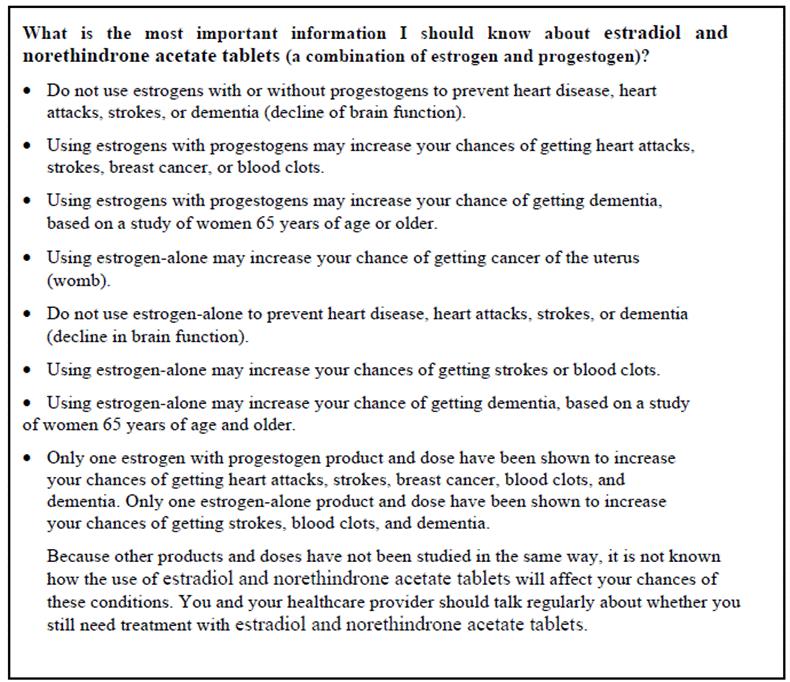
A text panel providing important safety information about estradiol and norethindrone acetate tablets, a combination of estrogen and progestogen. It details risks related to using estrogens with or without progestogens, including heart disease, strokes, dementia, breast cancer, and blood clots. It emphasizes the need for regular consultation with a healthcare provider regarding treatment continuation.*
FDA Label Image

Image (Image 13)

Image (Image 13)
An illustrated example of a weekly pill organizer for Estradiol and Norethindrone Acetate tablets showing days of the week from Sunday to Saturday across four weeks. Each row contains seven round pill compartments labeled as yellow (active) pills. Instructions direct the user to take pills from left to right each week. The card includes a section for tablet information on the right side.*
FDA Label Image

Image (Image 14)

Image (Image 14)
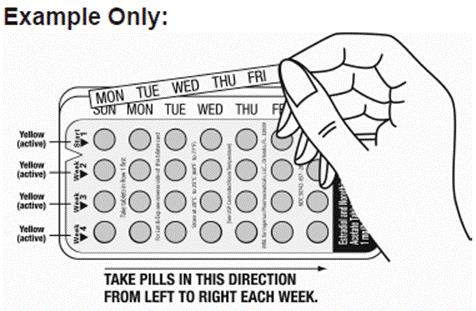
Instructional diagram showing oral tablet blister pack for Estradiol and Norethindrone Acetate with days of the week labeled above pill slots. The image illustrates a hand peeling back the blister foil and includes directional arrows indicating to take the pills left to right each week, emphasizing adherence to a daily schedule.*
FDA Label Image

Image (Image 15)

FDA Label Image

Image (Image 16)

Image (Image 16)
Packaging label for Estradiol and Norethindrone Acetate Tablets, USP 1 mg/0.5 mg oral tablets by Ingenus Pharmaceuticals, LLC. The label indicates one blister card of 28 yellow tablets and includes warning and storage information. The product is Rx only and manufactured for Ingenus Pharmaceuticals in Orlando, FL.*
FDA Label Image

Image (Image 17)

Image (Image 17)
Packaging label for Estradiol and Norethindrone Acetate Tablets, USP 0.5 mg/0.1 mg oral tablets by Ingenus Pharmaceuticals, LLC. The label indicates a blister card containing 28 tablets. It includes dosage strength information, manufacturer details, storage instructions, and a purple flower graphic.*
FDA Label Image

Image (Image 18)

Image (Image 18)
Table showing treatment-emergent adverse reactions at a frequency of 5% or more in studies of Estradiol and Norethindrone Acetate Tablets 1 mg/0.5 mg, including Endometrial Hyperplasia, Vasomotor Symptoms, and Osteoporosis studies. The table categorizes adverse events by body system and compares E2/NETA tablets versus placebo or other groups.*
FDA Label Image

Image (Image 19)

Image (Image 19)
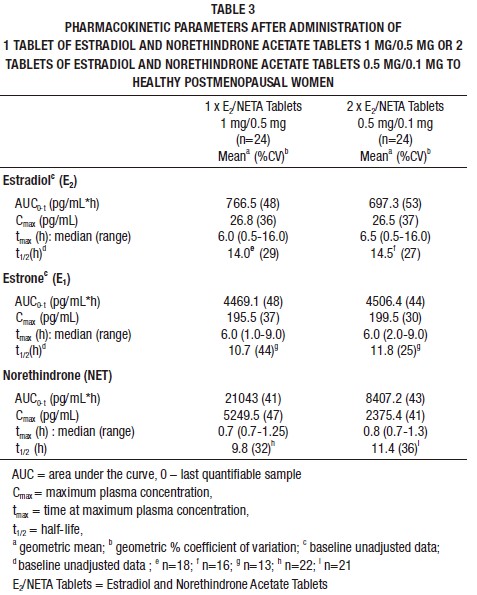
A pharmacokinetic parameters table for Estradiol and Norethindrone Acetate tablets in healthy postmenopausal women. It compares values for 1 tablet of 1 mg/0.5 mg strength and 2 tablets of 0.5 mg/0.1 mg strength, showing mean area under the curve (AUC), maximum plasma concentration (Cmax), time at maximum concentration (tmax), and half-life (t1/2) for Estradiol, Estrone, and Norethindrone.*

* About these descriptions: Image descriptions on this page are generated by automated AI analysis of the product label images from the manufacturer's FDA label submission (SPL). They are provided for reference only and may contain errors or omissions. Always rely on the printed label itself and the official FDA labeling, and consult a pharmacist or healthcare professional with any questions about this product.