Product Images Clopidogrel

View Photos of Packaging, Labels & Appearance

Product Label Images

The following 11 images provide visual information about the product associated with Clopidogrel NDC 51407-032 by Golden State Medical Supply, Inc., such as packaging, labeling, and the appearance of the drug itself. This resource could be helpful for medical professionals, pharmacists, and patients seeking to verify medication information and ensure they have the correct product.

51407 032 30LB

51407 032 30LB

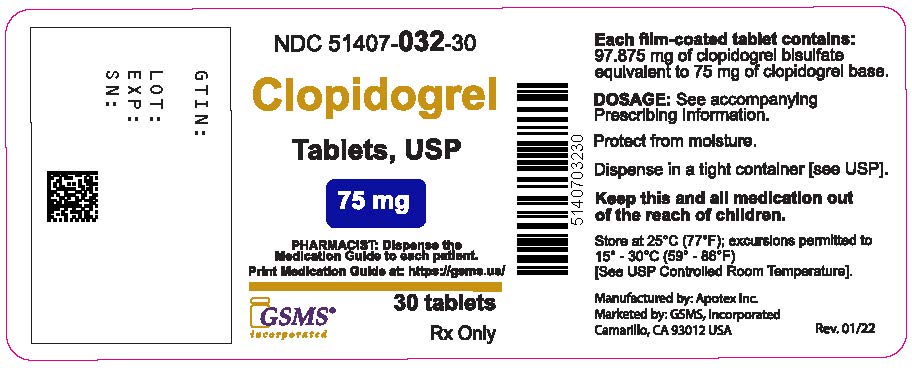
This is a medication guide for the drug INTIL9. It contains 75mg of clopidogrel base and comes in tablet form. Dosage instructions are included and it should be stored in a tight container at 25°C. The drug should be kept out of reach of children. It is manufactured by Apotex Inc. and marketed by GSMS, Incorporated. This drug is only available through prescription.*

Figure3.jpg - Figure3

Figure3.jpg - Figure3

Figure3b.jpg - Figure3b

Figure3b.jpg - Figure3b

The given text is related to a table that shows hazard ratio for patient baseline characteristics and on-study concomitant medications/interventions for the CURE Study. It includes subgroup, N, Clopidogrel, Placebo, Favors Clopidogrel, and Favors Placcbo. The extracted information is not enough to understand or interpret the data in the table, as it is incomplete and includes many typos.*

Figure6.jpg - Figure6

Figure6.jpg - Figure6

The text seems to be a table or chart showing the effects of adding Clopidogrel to Aspirin on the Combined Primary Endpoint across Baseline and Concomitant Medication Subgroups for the COMMIT Study. It includes information on gender, heart rate, fibrinolytic agent given, number of people in the subgroup, and the percentage who benefitted from the treatment. It also shows odds ratio data for each group.*

Figure7.jpg - Figure7

Figure7.jpg - Figure7

The text is a description of Figure 7 from the CAPRIE study, showing the cumulative event rate of fatal or non-fatal vascular events. The study compares the effectiveness of clopidogrel against other medication. It includes a graph with data of event rates over 12 to 24 months of follow-up. Therefore, the text is not very useful alone.*

Figure8.jpg - Figure8

Figure8.jpg - Figure8

figure-01.jpg - figure 01

figure-01.jpg - figure 01

The text describes a figure (Figure 1) that shows the effects of multiple doses of Clopidogrel 75 mg alone or with different Proton Pump Inhibitors (PPIs) on exposure to Clopidogrel Active Metabolite. The figure includes a table with the co-administered PBI effects on active metabolite AUC, mean and 90% confidence interval. The PPIs included in the table are Dextansoprazole, Lansoprazole, Pastoprazole, and Omeprazole. The figure also shows the change relative to Clopidogrel administered alone.*

figure2.jpg - figure2

figure2.jpg - figure2

The image shows a graph presenting the cumulative event rate in percentages for cardiovascular death, myocardial infarction, and stroke observed in the CURE study. The graph compares the results from a placebo group (using aspirin) with the results from a group treated with clopidogrel (also using aspirin), showing a significant difference between them. The study lasted around 12 months. Standard therapies were used as appropriate.*

figure4.jpg - figure4

figure4.jpg - figure4

The text describes Figure 4 showing the cumulative event rates for death in the COMMIT study. The figure shows the percentage of deaths (81%) in the placebo group and the percentage of deaths (75%) in the treatment group. The text also mentions a proportional risk reduction of 7% (p-033) and that all the patients in the study were included in the results.*

figure5.jpg - figure5

figure5.jpg - figure5

This is a figure (Figure 5) presenting the cumulative event rates for the combined endpoint of re-infarction, stroke or death in the COMMIT study. The study included patients who received either placebo or clopidogrel with aspirin. The figure shows that the proportion of patients with events was 10.1% for placebo and 8.2% for clopidogrel, corresponding to a 9% reduction in proportional risk, which is statistically significant (p value not given). The figure also shows that most events occurred within the first 5 days since randomization, but events continued to occur throughout the 28-day follow-up period.*

image100

image100

* The product label images have been analyzed using a combination of traditional computing and machine learning techniques. It should be noted that the descriptions provided may not be entirely accurate as they are experimental in nature. Use the information in this page at your own discretion and risk.