Clobazam Tablet
Product Images NDC 51407-585

View Photos of Packaging, Regulatory Labels, and Product Appearance

Product Visual Gallery

This gallery contains 5 technical images submitted to the FDA as part of the official labeling for Clobazam (NDC 51407-585). Unlike standard consumer photos, these assets often include clinical data figures, molecular chemical structures, and official manufacturer packaging layouts.

As provided by Golden State Medical Supply, Inc., these visuals offer a comprehensive scientific overview of the product's physical and chemical identity, aiding pharmacists and researchers in product verification and study.

FDA Label Image

51407-585-01ol.jpg (51407 585 01ol)
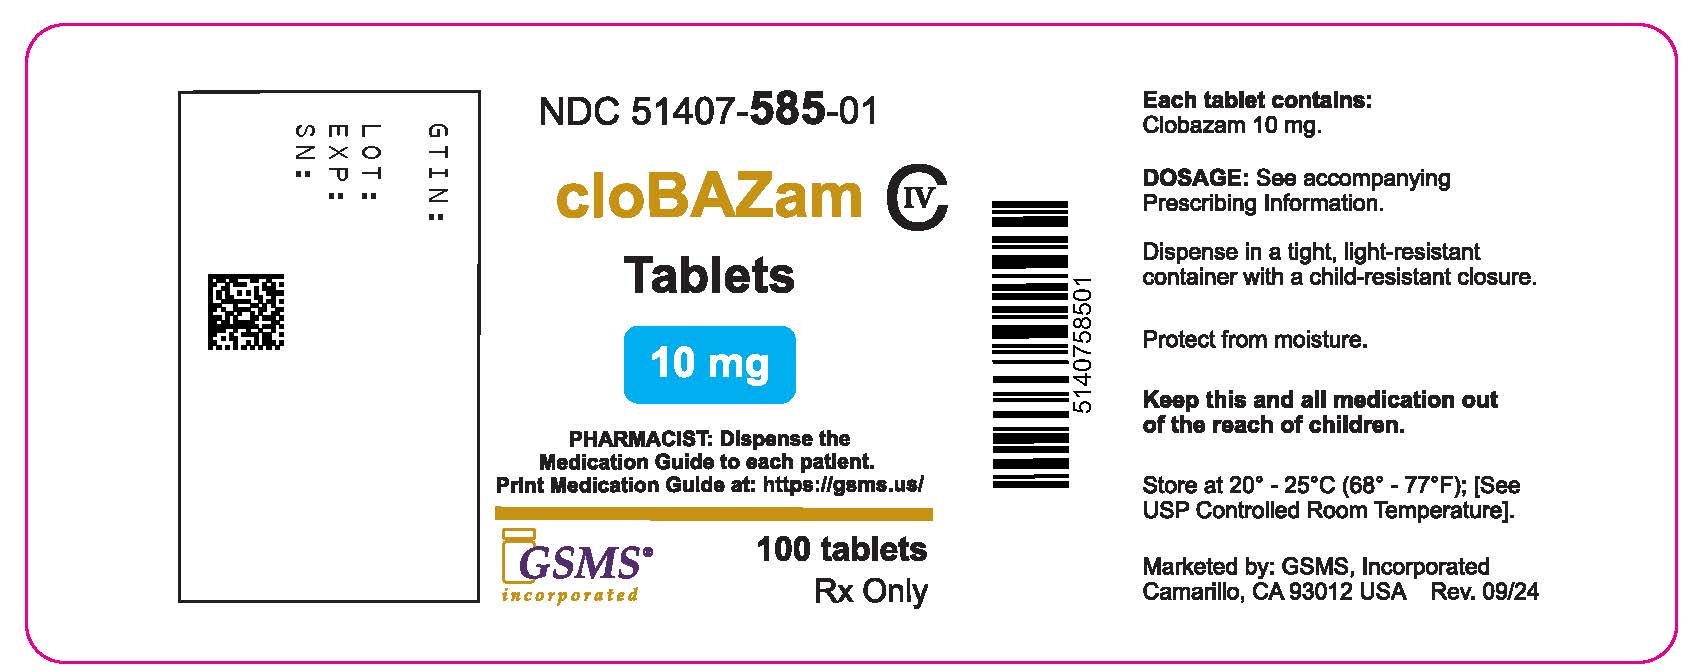
51407-585-01ol.jpg (51407 585 01ol)
Label for Clobazam 10 mg oral tablets, containing 100 tablets per container. The label includes the NDC 51407-585-01 and instructions for pharmacists to dispense the medication guide. It is marketed by GSMS Incorporated and advises storage at 20°-25°C. The label contains warnings to keep medication out of children’s reach and to protect from moisture.*
FDA Label Image

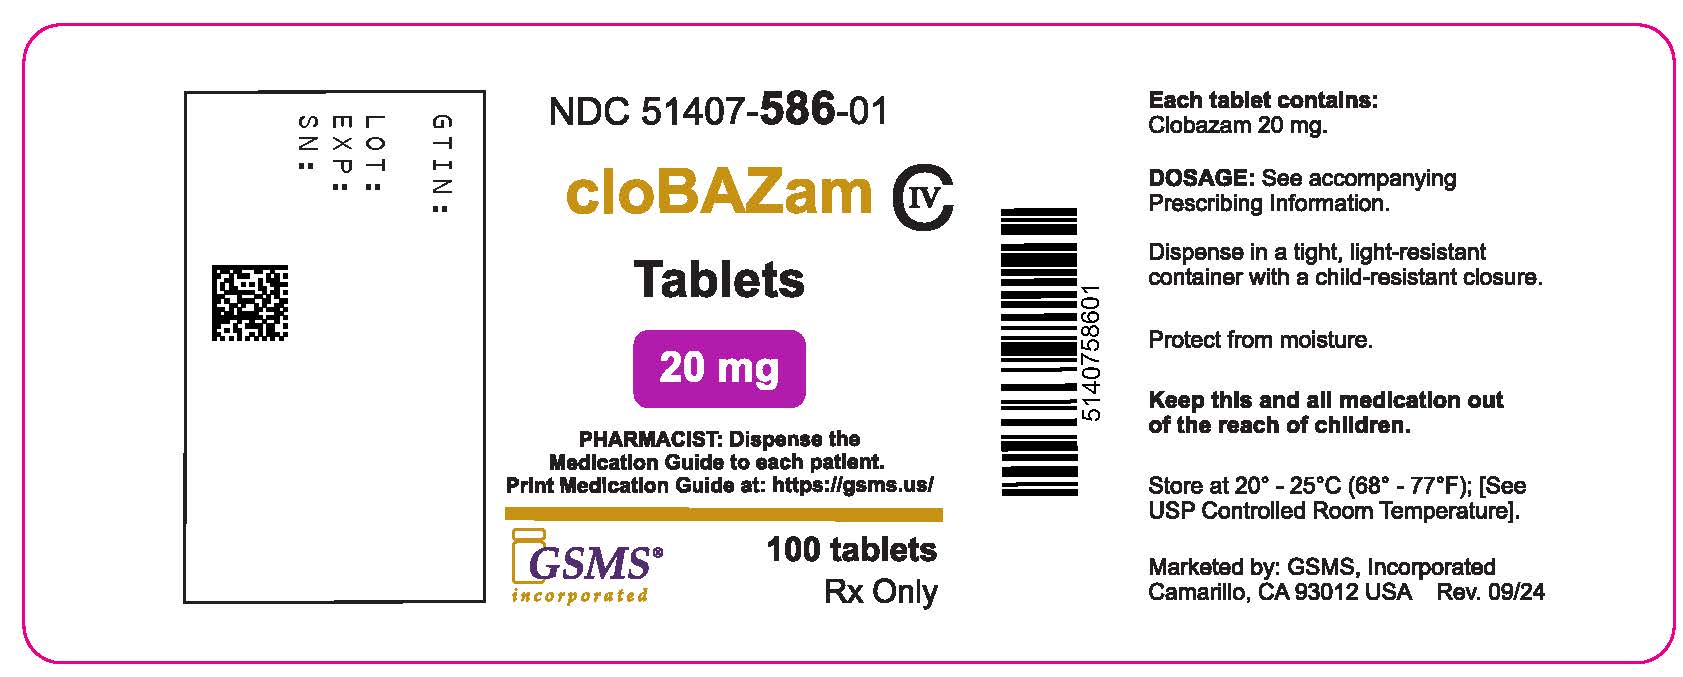
51407-586-01ol.jpg (51407 586 01ol)

51407-586-01ol.jpg (51407 586 01ol)
Clobazam 20 mg tablets label from Golden State Medical Supply, Inc. The label shows the product name cloBAZam, strength 20 mg, and package count of 100 tablets. It includes dosage and storage instructions and a barcode. The NDC is 51407-586-01.*
FDA Label Image

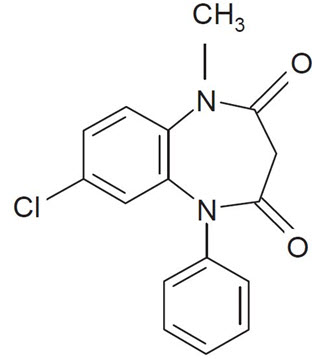
Chemical Structure (Clobazam 01)

Chemical Structure (Clobazam 01)
Chemical structure diagram of Clobazam, showing benzodiazepine core with chloro, methyl, and phenyl functional groups.*
FDA Label Image

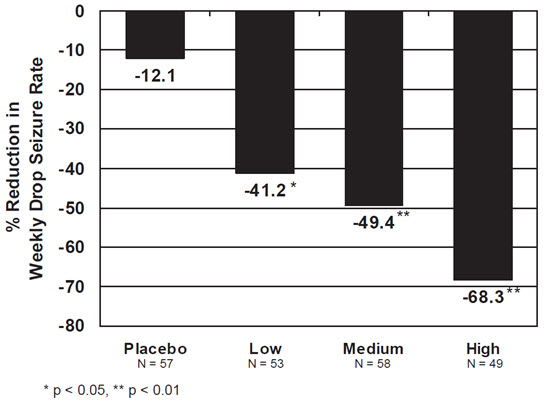
Figure 1 (Clobazam 02)

Figure 1 (Clobazam 02)
A bar chart showing percentage reduction in weekly drop seizure rate across four groups: Placebo, Low dose, Medium dose, and High dose. Each bar displays the corresponding percentage reduction, with placebo showing the smallest reduction and high dose showing the largest, indicating increased effectiveness with higher doses.*
FDA Label Image

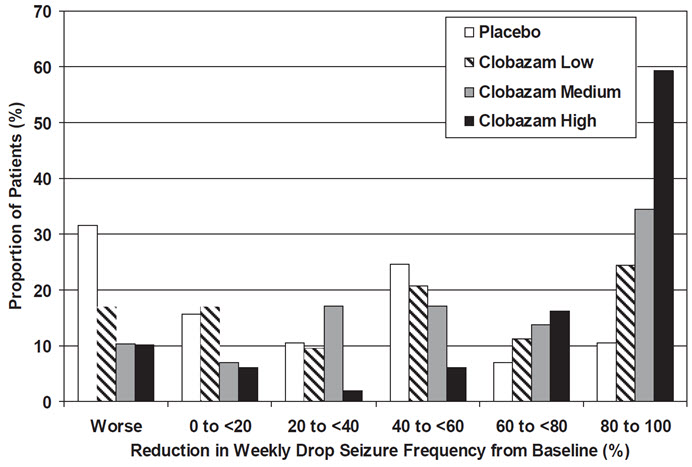
Figure 2 (Clobazam 03)

Figure 2 (Clobazam 03)
A bar chart showing the proportion of patients (%) on the y-axis and reduction in weekly drop seizure frequency from baseline (%) on the x-axis. The chart compares four groups: Placebo, Clobazam Low, Clobazam Medium, and Clobazam High, across different ranges of seizure frequency reduction from Worse to 80 to 100%. The data illustrate varying patient distribution across these reduction categories for each group.*

* About these descriptions: Image descriptions on this page are generated by automated AI analysis of the product label images from the manufacturer's FDA label submission (SPL). They are provided for reference only and may contain errors or omissions. Always rely on the printed label itself and the official FDA labeling, and consult a pharmacist or healthcare professional with any questions about this product.