Product Images Entecavir

View Photos of Packaging, Labels & Appearance

Product Label Images

The following 10 images provide visual information about the product associated with Entecavir NDC 51407-589 by Golden State Medical Supply, Inc., such as packaging, labeling, and the appearance of the drug itself. This resource could be helpful for medical professionals, pharmacists, and patients seeking to verify medication information and ensure they have the correct product.

51407-589-30OL.jpg - 51407 589 30OL

51407-589-30OL.jpg - 51407 589 30OL

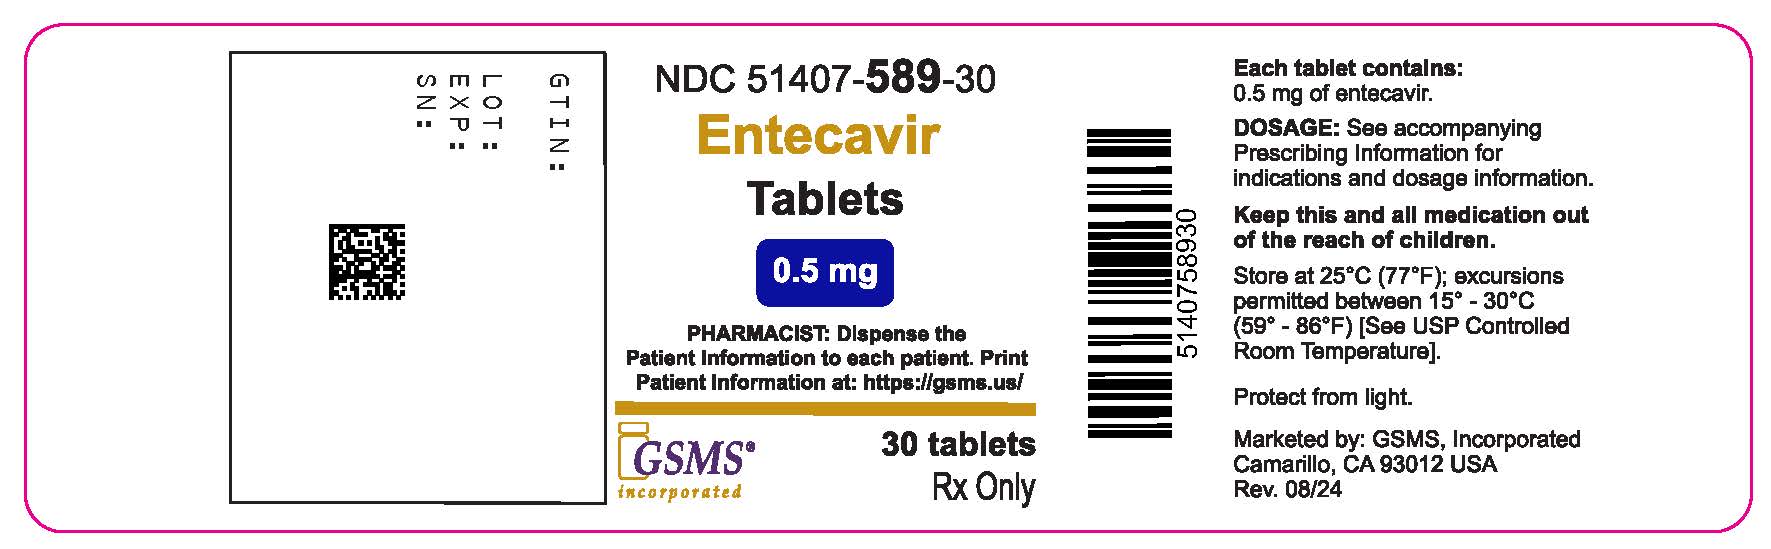
This is a description of a medication with the NDC number 51407-589-30. It is in the form of tablets, each containing 0.5 mg of entecavir. The recommended dosage and storage instructions are provided, along with the advice to keep the medication out of reach of children and protected from light. The medication is to be dispensed with patient information available at the provided website. It is marked for prescription use only and is marketed by GSMS, Incorporated.*

Table 10 - Table 10 Entecavir Insert

Table 10 - Table 10 Entecavir Insert

This data table shows selected virologic, biochemical, and serologic endpoints for nucleoside-inhibitor-naive subjects in studies Al463022 and Al463027 at Week 48. The endpoints include viral load suppression (<300 copies/mL), ALT normalization, proportion undetectable, and HBeAg seroconversion for the subjects receiving Entecavir and Lamivudine.*

Table 11 - Table 11 Entecavir Insert

Table 11 - Table 11 Entecavir Insert

This is a statistical table showing the histologic improvement and change in Ishak Fibrosis Score at Week 48 for Lamivudine-Refractory Subjects in Study 41463026 who were treated with Entecavir and Lamivudine. The table details the number of subjects in each treatment group, percentages of histologic improvement based on Knodell scores, and changes in Ishak Fibrosis Score. The data indicates higher rates of histologic improvement and lower rates of worsening in the Entecavir group compared to the Lamivudine group. Additionally, there were some missing Week 48 biopsies in both groups.*

Table 12 - Table 12 Entecavir Insert

Table 12 - Table 12 Entecavir Insert

This data table shows the comparison of selected virologic, biochemical, and serologic endpoints for Lamivudine-Refractory Subjects treated with Entecavir and Lamivudine at Week 48. It includes information on the proportion of undetectable HBV DNA levels, change from baseline in viral load, ALT normalization, and HBeAg seroconversion. The results indicate that Entecavir outperformed Lamivudine in terms of achieving undetectable HBV DNA levels, viral load reduction, ALT normalization, and HBeAg seroconversion.*

Table 13 - Table 13 Entecavir Insert

Table 13 - Table 13 Entecavir Insert

This information provides a summary of selected endpoints at Week 48 for subjects with decompensated liver disease in a study comparing Entecavir and Adefovir Dipivoxil. It includes proportions of undetectable HEV DNA, stability or improvement in CTP score, HBsAg loss, normalization of ALT, and total number of participants at specified doses.*

Table 14 - Table 14 Entecavir Insert

Table 14 - Table 14 Entecavir Insert

This text provides data on virologic and biochemical endpoints achieved at week 24 in a study named Al463038. It compares the results between patients treated with Entecavir and those who received a placebo. Key findings include the proportion of patients with undetectable viral load (<300 copies/mL) being 6% for Entecavir group and 0% for the placebo group. The mean change from baseline in log10 copies/mL was -3.65 for the Entecavir group and +0.11 for the placebo group. Normalization of ALT levels (≤1 x ULN) was reported in 34% of patients in the Entecavir group and 8% in the placebo group at week 24.*

Table 3 - Table 3 Entecavir Insert

Table 3 - Table 3 Entecavir Insert

This is a statistical table providing information on Clinical Adverse Reactions of moderate-severe intensity (Grades 2-4) reported in four Entecavir clinical trials over a period of 2 years. The data compares the adverse reactions between Nucleoside-Inhibitor-Naive and Lamivudine-Refractory patients. It includes information on various body systems such as Gastrointestinal, General, Nervous System, and Psychiatric, detailing the percentage of patients experiencing adverse reactions such as diarrhea, dyspepsia, nausea, vomiting, fatigue, headaches, dizziness, somnolence, and insomnia.*

Table 4 - Table 4 Entecavir Insert

Table 4 - Table 4 Entecavir Insert

This text describes selected treatment-emergent laboratory abnormalities reported in four Entecavir clinical trials through 2 years. It includes information on various parameters such as ALT levels, albumin levels, total bilirubin levels, lipase levels, creatinine levels, fasting glucose levels, glycosuria, hematuria, and platelet count. The data provides insight into the occurrence rates of these abnormalities in different groups receiving Entecavir in comparison to Lamivudine.*

Table 9 - Table 9 Entecavir Insert

Table 9 - Table 9 Entecavir Insert

This text provides data on histologic improvement and changes in Ishak Fibrosis Score at Week 48 for nucleoside-inhibitor-naive subjects in two different studies. It compares the effectiveness of Entecavir and Lamivudine treatments for both HBeAg-Positive and HBeAg-Negative individuals, with details on the percentage of improvement, no change, and worsening in the Ishak Fibrosis Score. The text also indicates the percentage of missing Week 48 biopsies for each treatment group.*

Structural Formula - structural formula entecavir

Structural Formula - structural formula entecavir

* The product label images have been analyzed using a combination of traditional computing and machine learning techniques. It should be noted that the descriptions provided may not be entirely accurate as they are experimental in nature. Use the information in this page at your own discretion and risk.