Aprepitant Capsule
Product Images NDC 51407-702

10 FDA label images from Golden State Medical Supply, Inc. · Packaging, Regulatory Labels, and Product Appearance

Product Visual Gallery

This gallery contains 10 technical images submitted to the FDA as part of the official labeling for Aprepitant (NDC 51407-702). Unlike standard consumer photos, these assets often include clinical data figures, molecular chemical structures, and official manufacturer packaging layouts.

As provided by Golden State Medical Supply, Inc., these visuals offer a comprehensive scientific overview of the product's physical and chemical identity, aiding pharmacists and researchers in product verification and study.

FDA Label Image

Structural Formula (B98c7956 Cd1b 476f Be29 Abec7d42aeb1 01)
Structural Formula (B98c7956 Cd1b 476f Be29 Abec7d42aeb1 01)
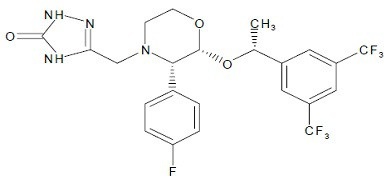
Chemical structure diagram of aprepitant, illustrating its molecular framework with labeled atoms and functional groups.*
FDA Label Image

Figure 1 (B98c7956 Cd1b 476f Be29 Abec7d42aeb1 02)

Figure 1 (B98c7956 Cd1b 476f Be29 Abec7d42aeb1 02)
Two line graphs titled Study 1 and Study 2 compare the percent of patients over time (hours) for Aprepitant Regimen versus Standard Therapy. Each graph shows patient survival or response rates with Aprepitant Regimen maintaining a higher percentage of patients compared to Standard Therapy up to 120 hours. Sample sizes for each treatment group are indicated.*
FDA Label Image

Figure 2 (B98c7956 Cd1b 476f Be29 Abec7d42aeb1 03)

Figure 2 (B98c7956 Cd1b 476f Be29 Abec7d42aeb1 03)
Two bar graphs labeled Study 1 and Study 2 showing the percentage of patients across chemotherapy cycles 2 to 6. Each graph compares patients on the Aprepitant Regimen versus Standard Therapy. The y-axis represents the percent of patients, and the x-axis indicates chemotherapy cycles. Patient counts for each group and cycle are listed below each graph.*
FDA Label Image

Figure 3 (B98c7956 Cd1b 476f Be29 Abec7d42aeb1 04)

Figure 3 (B98c7956 Cd1b 476f Be29 Abec7d42aeb1 04)
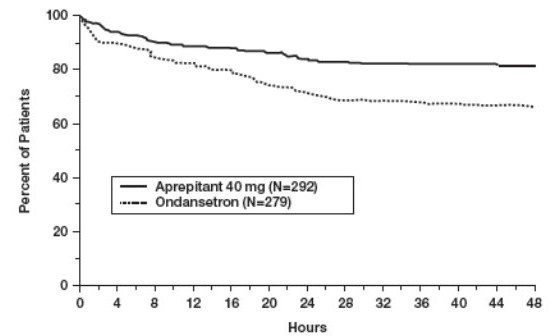
A survival curve graph comparing the percent of patients over time (up to 48 hours) for Aprepitant 40 mg versus Ondansetron. The graph shows a higher percentage of patients maintained on Aprepitant 40 mg compared to Ondansetron throughout the time course. The x-axis is labeled Hours and the y-axis is labeled Percent of Patients.*
FDA Label Image

Torrent Logo (B98c7956 Cd1b 476f Be29 Abec7d42aeb1 05)

FDA Label Image

Logo (B98c7956 Cd1b 476f Be29 Abec7d42aeb1 06)

FDA Label Image

Aprepitant Aw Final Approvals (40mg Carton 51407-701-05.jpg)

FDA Label Image

Aprepitant Aw Final Approvals (80mg Carton 51407-702-06.jpg)

FDA Label Image

Aprepitant Aw Final Approvals (125mg Carton 51407-703-06.jpg)

FDA Label Image

Aprepitant Aw Final Approvals (125mg_80mg)

* About these descriptions: Image descriptions on this page are generated by automated AI analysis of the product label images from the manufacturer's FDA label submission (SPL). They are provided for reference only and may contain errors or omissions. Always rely on the printed label itself and the official FDA labeling, and consult a pharmacist or healthcare professional with any questions about this product.