Droxidopa Capsule
Product Images NDC 51407-767

View Photos of Packaging, Regulatory Labels, and Product Appearance

Product Visual Gallery

This gallery contains 6 technical images submitted to the FDA as part of the official labeling for Droxidopa (NDC 51407-767). Unlike standard consumer photos, these assets often include clinical data figures, molecular chemical structures, and official manufacturer packaging layouts.

As provided by Golden State Medical Supply, Inc., these visuals offer a comprehensive scientific overview of the product's physical and chemical identity, aiding pharmacists and researchers in product verification and study.

FDA Label Image

51407-765-90.jpg (51407 765 90)
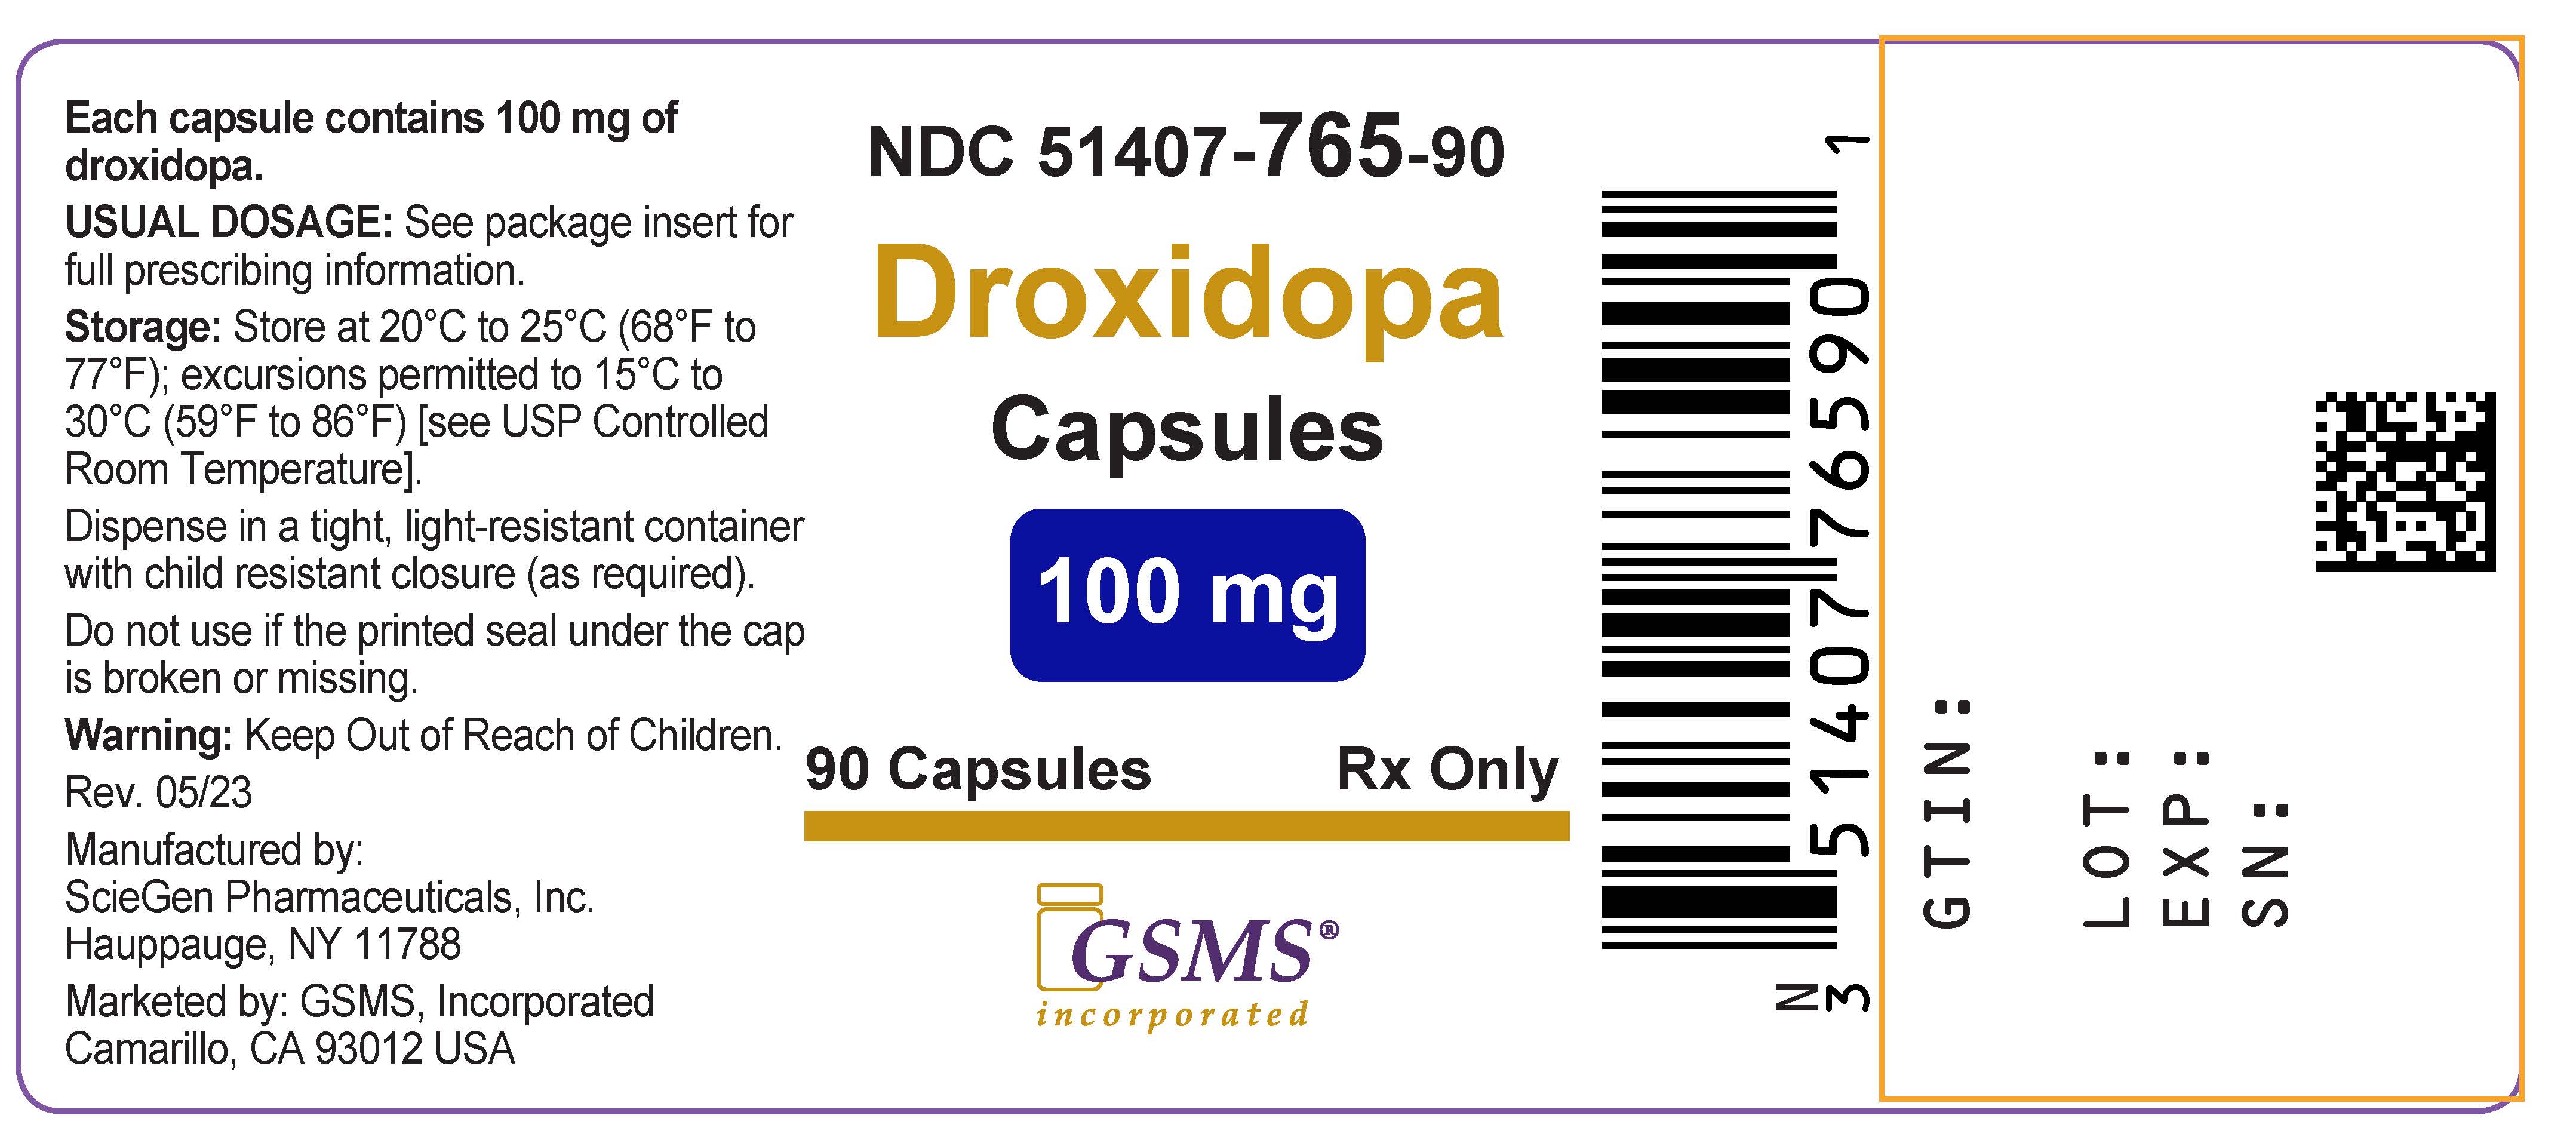
51407-765-90.jpg (51407 765 90)
Droxidopa 100 mg capsules label showing the product name, strength, dosage form, and quantity of 90 capsules. The label includes storage instructions, a barcode, and manufacturer information for ScieGen Pharmaceuticals, Inc. It also states 'Rx Only' and contains warning and dosage information.*
FDA Label Image

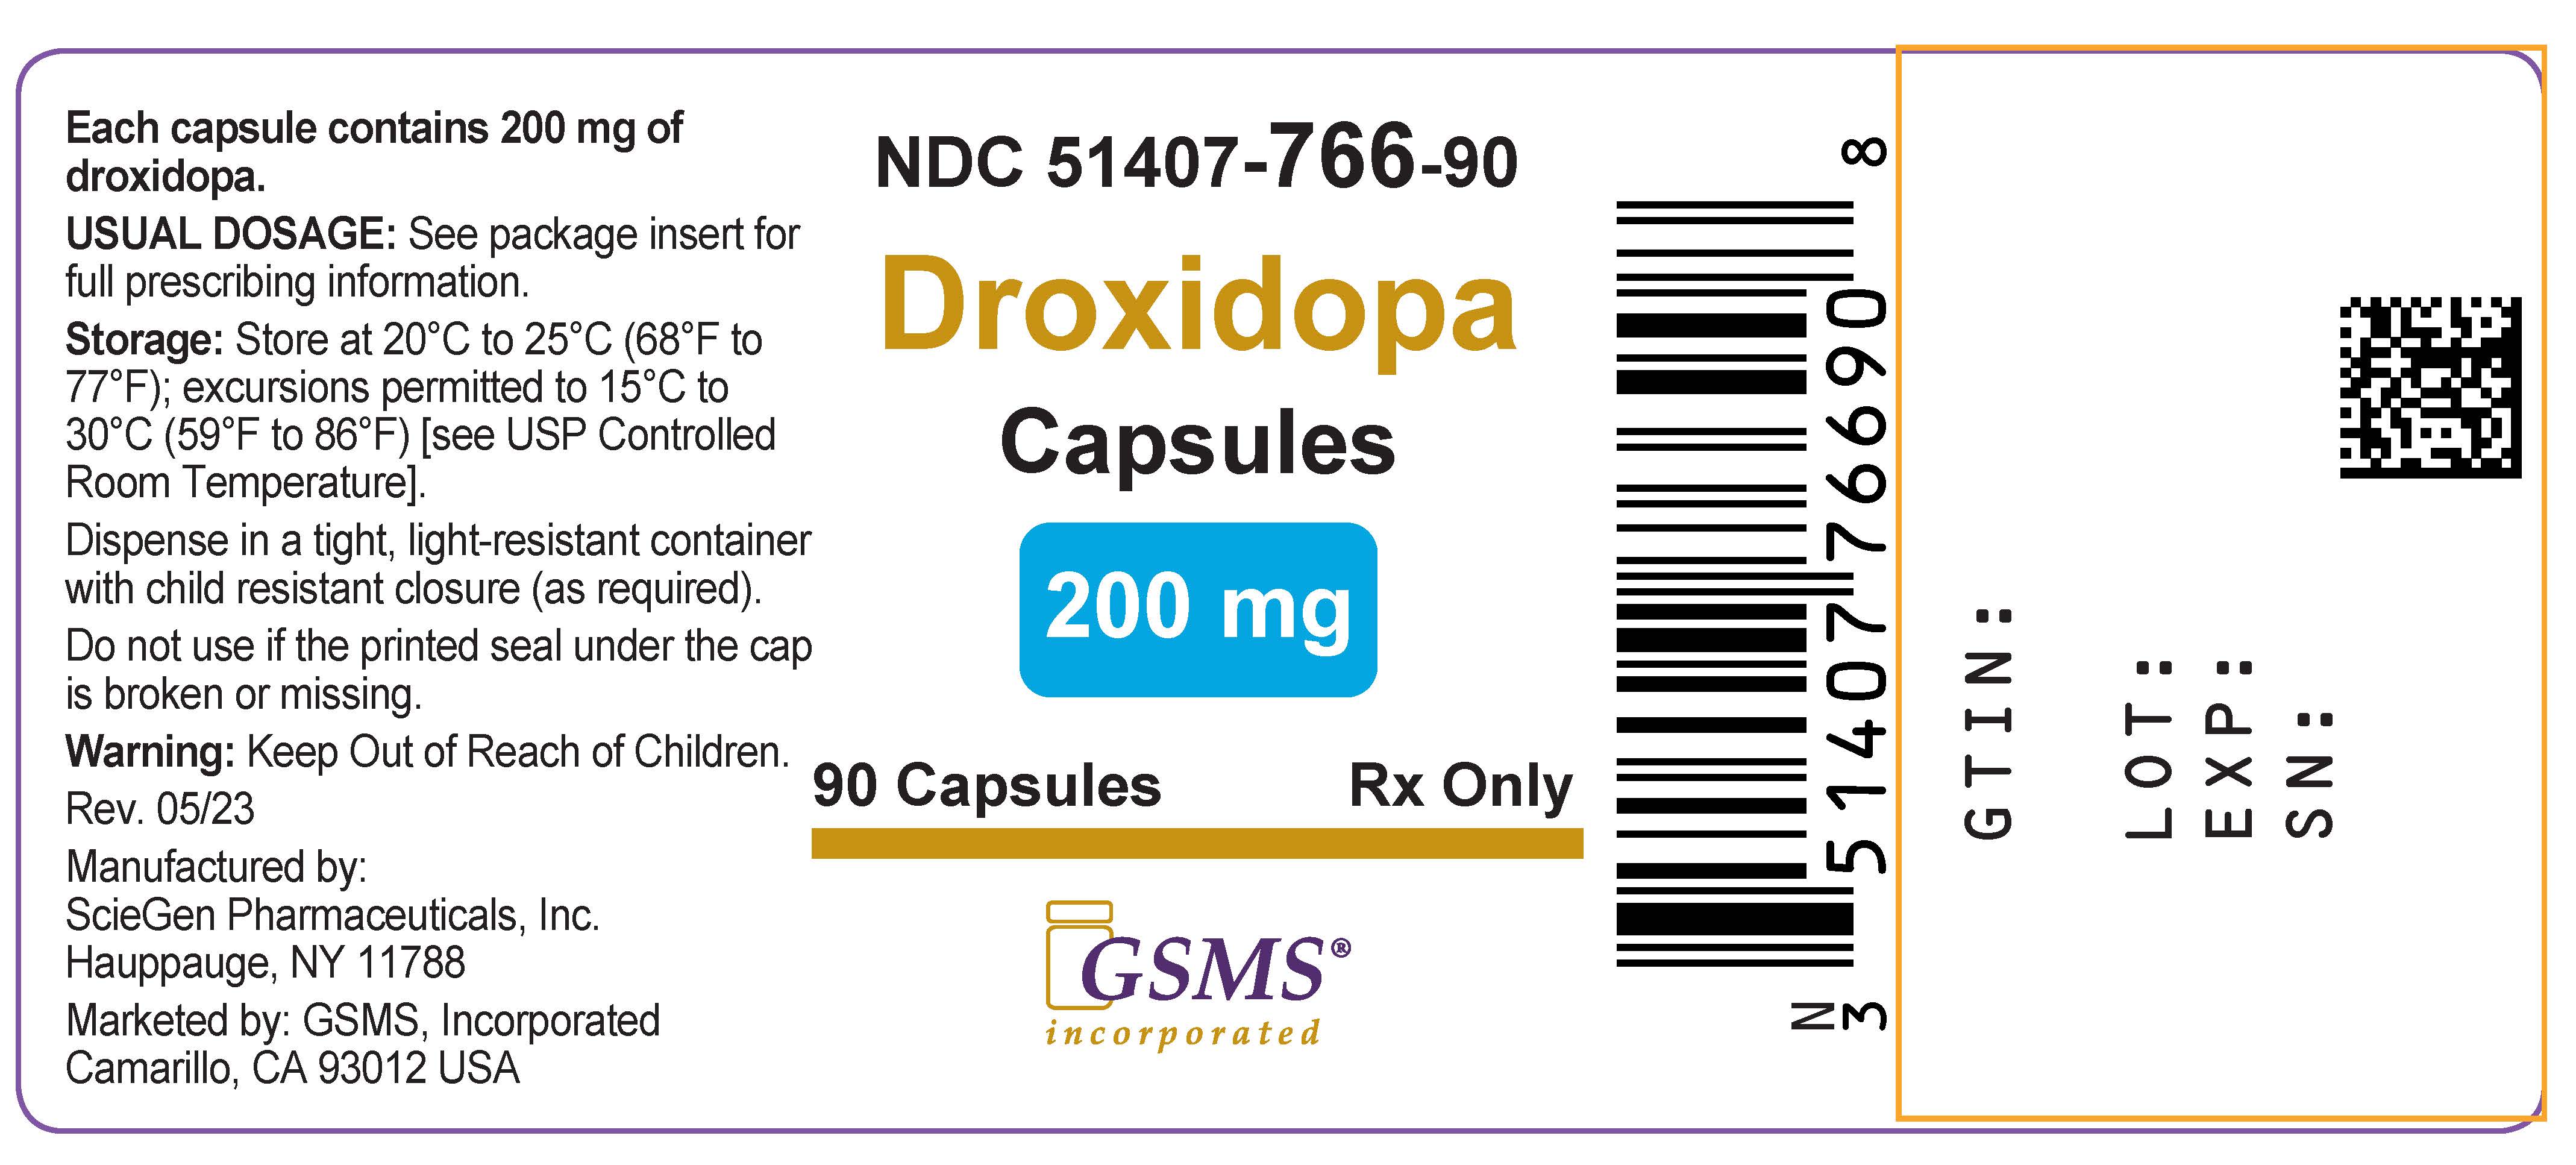
51407-766-90.jpg (51407 766 90)

51407-766-90.jpg (51407 766 90)
Droxidopa 200 mg capsules label showing the product name, dosage form as capsules, and strength of 200 mg. The label states the package contains 90 capsules and is Rx only. It includes storage instructions, warnings, and manufacturer information (ScieGen Pharmaceuticals, Inc.). The label also features a barcode and logo for GSMS Incorporated.*
FDA Label Image

51407-767-90.jpg (51407 767 90)

51407-767-90.jpg (51407 767 90)
Droxidopa 300 mg capsules label showing the drug name, dosage strength, and quantity of 90 capsules. The label displays the NDC number 51407-767-90, manufacturer ScieGen Pharmaceuticals, and marketer GSMS, Incorporated. Storage instructions, usage warnings, barcode, and a GSMS logo are also visible.*
FDA Label Image

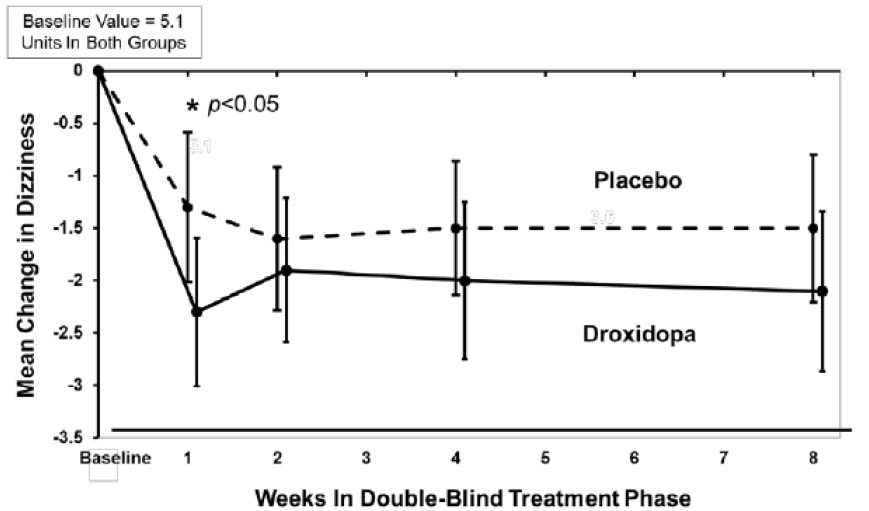
Mean Change In Ohsa (Droxidopa Fig01)

Mean Change In Ohsa (Droxidopa Fig01)
Line graph depicting mean change in dizziness over 8 weeks during a double-blind treatment phase comparing Droxidopa and placebo. The y-axis shows mean change in dizziness while the x-axis shows weeks. Droxidopa group shows a greater initial decrease in dizziness compared to placebo, with statistical significance indicated at week 1 (p<0.05). Error bars represent variability within groups.*
FDA Label Image

Distribution Of Patients By Change In Ohsa (Droxidopa Fig02)

Distribution Of Patients By Change In Ohsa (Droxidopa Fig02)
A bar graph comparing the percentage of subjects reporting improvement in OHSA Question 1 scores between Droxidopa and placebo groups. The x-axis shows improvement scores from -8 (worse) to 8 (better), and the y-axis indicates percent of subjects. Black bars represent Droxidopa and white bars placebo, illustrating the distribution of responses across improvement levels.*
FDA Label Image

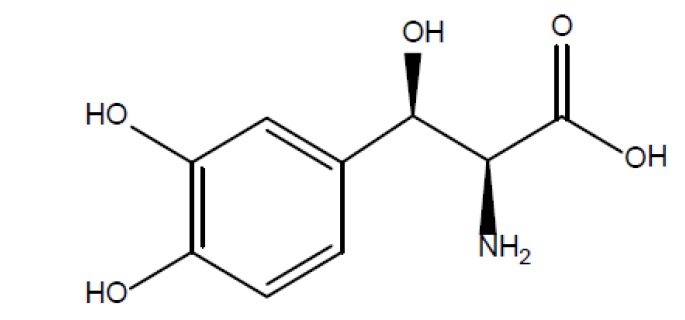
Droxidopa-01 (Droxidopa Str)

Droxidopa-01 (Droxidopa Str)
Chemical structure diagram of droxidopa showing its molecular composition with hydroxyl (OH), amino (NH2), and carboxylic acid (COOH) functional groups attached to a benzene ring.*

* About these descriptions: Image descriptions on this page are generated by automated AI analysis of the product label images from the manufacturer's FDA label submission (SPL). They are provided for reference only and may contain errors or omissions. Always rely on the printed label itself and the official FDA labeling, and consult a pharmacist or healthcare professional with any questions about this product.