Nintedanib Capsule
Product Images NDC 51407-984

View Photos of Packaging, Regulatory Labels, and Product Appearance

Product Visual Gallery

This gallery contains 12 technical images submitted to the FDA as part of the official labeling for Nintedanib (NDC 51407-984). Unlike standard consumer photos, these assets often include clinical data figures, molecular chemical structures, and official manufacturer packaging layouts.

As provided by Golden State Medical Supply, Inc., these visuals offer a comprehensive scientific overview of the product's physical and chemical identity, aiding pharmacists and researchers in product verification and study.

FDA Label Image

51407-984-60lb (Nintedanib Capsules 100mg)
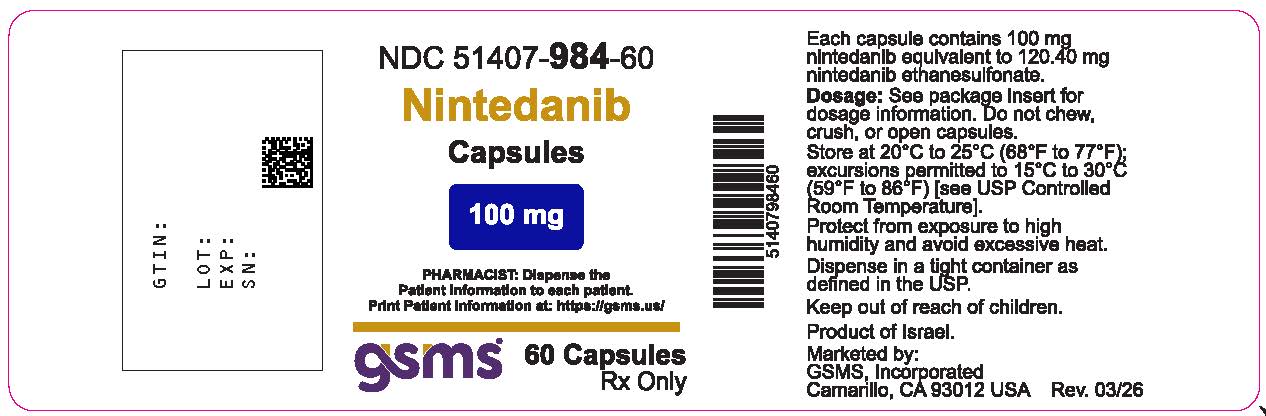
51407-984-60lb (Nintedanib Capsules 100mg)
Nintedanib 100 mg capsules label showing oral dosage form supplied by Golden State Medical Supply, Inc. The label includes NDC 51407-984-60 and indicates a package size of 60 capsules. Storage instructions and warnings about handling and dosage are also displayed.*
FDA Label Image

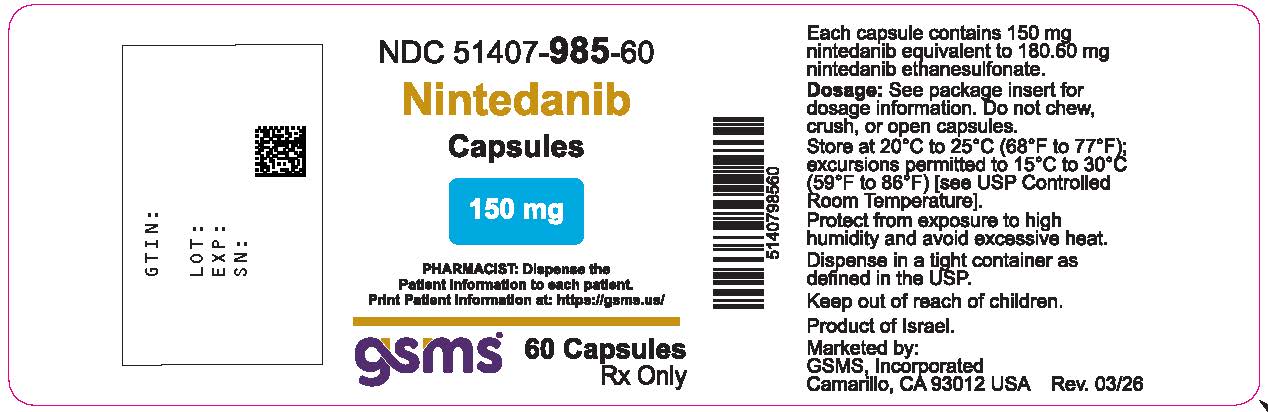
51407-985-60lb (Nintedanib Capsules 150mg)

51407-985-60lb (Nintedanib Capsules 150mg)
Nintedanib 150 mg capsules label showing product name, dosage strength, and oral capsule form. The label includes NDC 51407-985-60, a 60-capsule package count, and instructions for pharmacists to dispense patient information. It mentions storage conditions, warnings, and that the product is marketed by GSMS, Incorporated in Camarillo, CA, USA.*
FDA Label Image

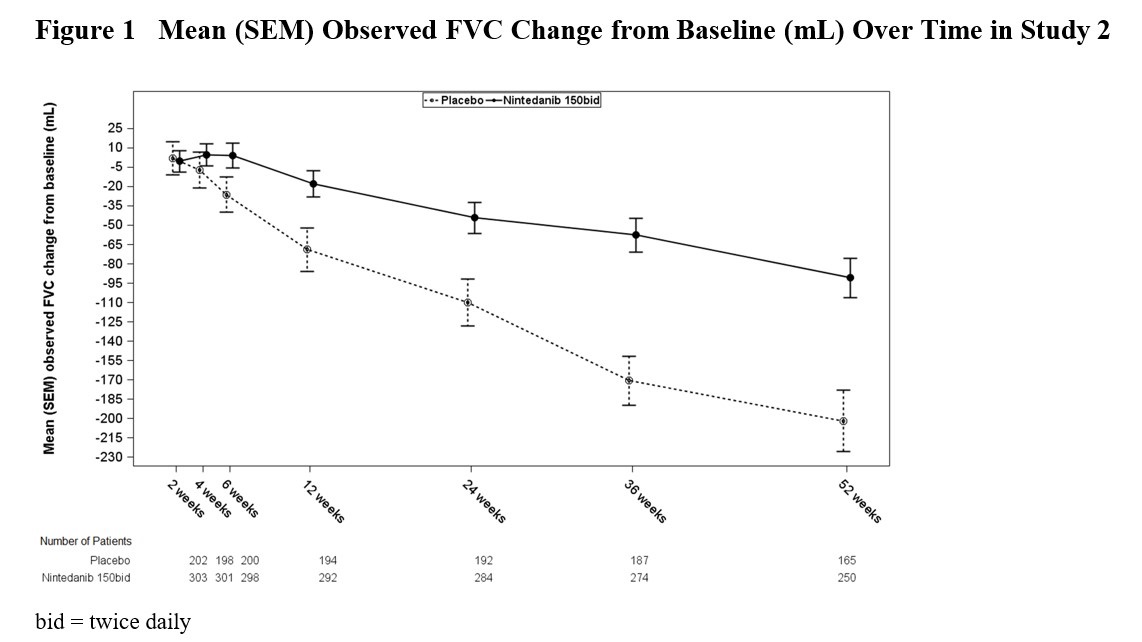
1 (Figure 1)

1 (Figure 1)
A line graph titled 'Mean (SEM) Observed FVC Change from Baseline (mL) Over Time in Study 2' comparing FVC change over weeks between Placebo and Nintedanib 150 mg twice daily. The graph shows mean FVC change on the y-axis (from +25 to -230 mL) and time in weeks (2 to 52 weeks) on the x-axis. Two lines with error bars represent the treatments, with patient numbers detailed below each time point.*
FDA Label Image

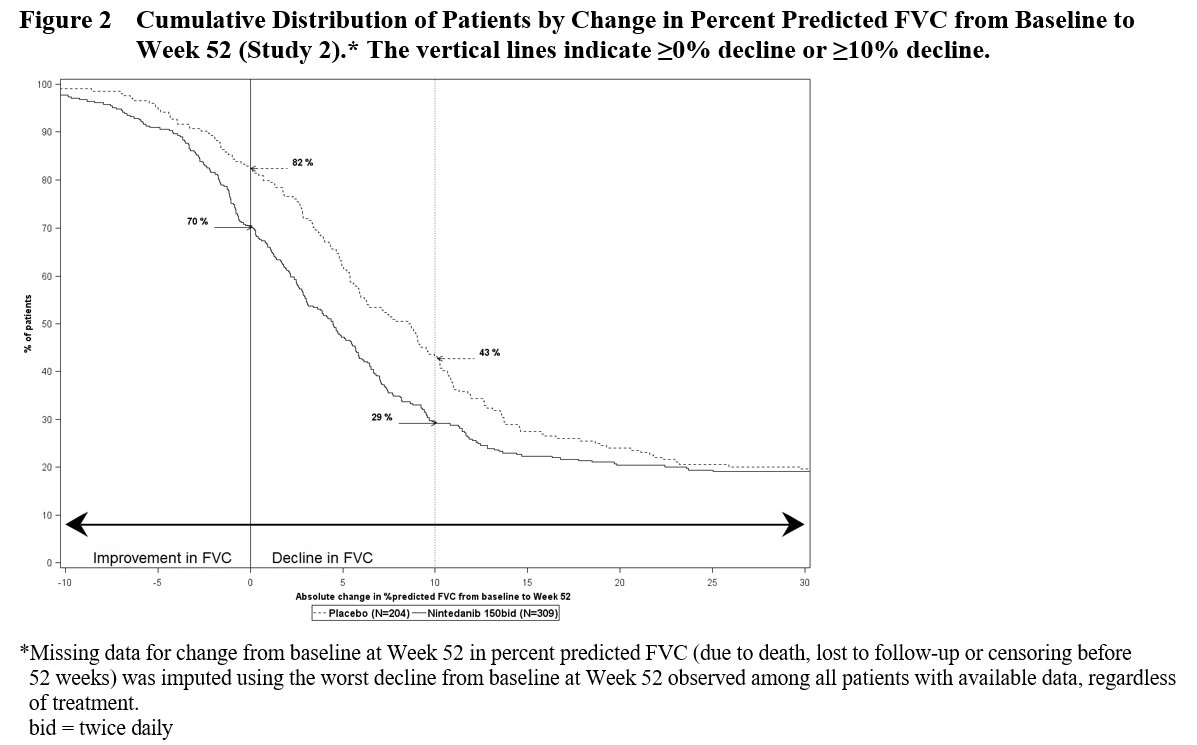
1 (Figure 2)

1 (Figure 2)
A cumulative distribution chart comparing patients by change in percent predicted Forced Vital Capacity (FVC) from baseline to Week 52 between a placebo group (N=204) and a Nintedanib 150 mg twice daily group (N=309). The x-axis shows absolute change in percent predicted FVC, ranging from about -10 to 30, with annotation indicating 'Improvement in FVC' to the left and 'Decline in FVC' to the right. The y-axis shows percent of patients from 0 to 100%. Vertical lines mark 0% decline and 10% decline thresholds. The chart illustrates differences in FVC changes over 52 weeks in the two groups.*
FDA Label Image

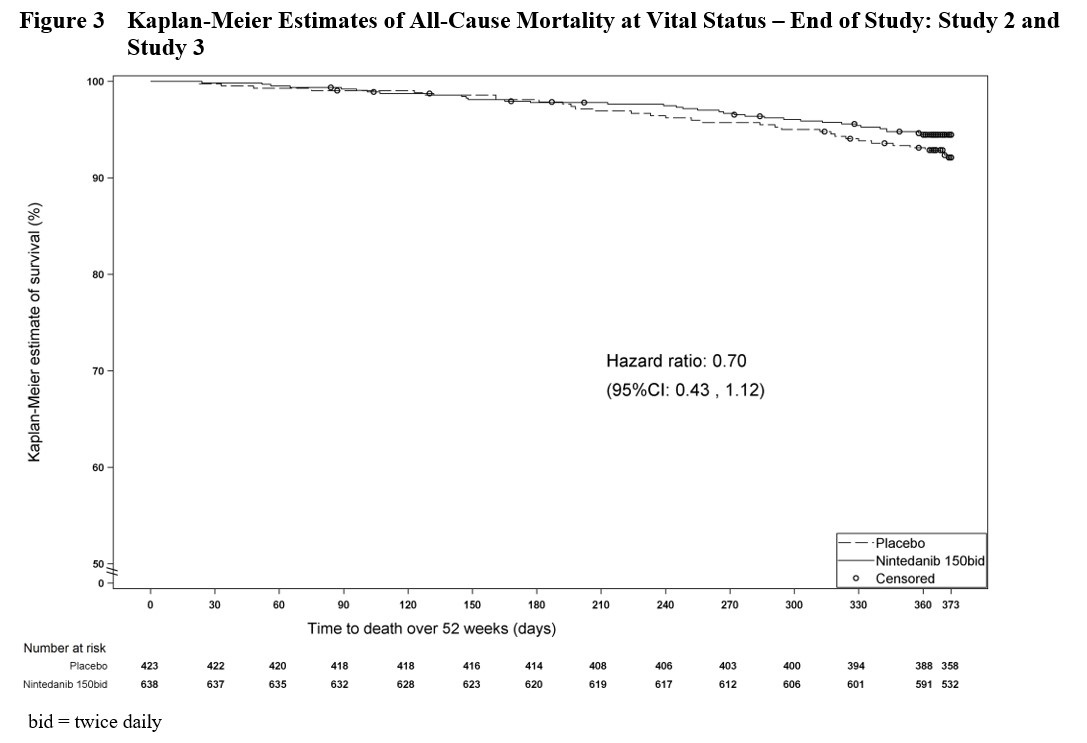
1 (Figure 3)

1 (Figure 3)
A Kaplan-Meier survival curve chart showing all-cause mortality estimates at vital status for Study 2 and Study 3 over 52 weeks. The chart compares placebo and Nintedanib 150 mg twice daily (bid), illustrating percent survival over time with censored data points marked. The hazard ratio and confidence interval are displayed on the graph.*
FDA Label Image

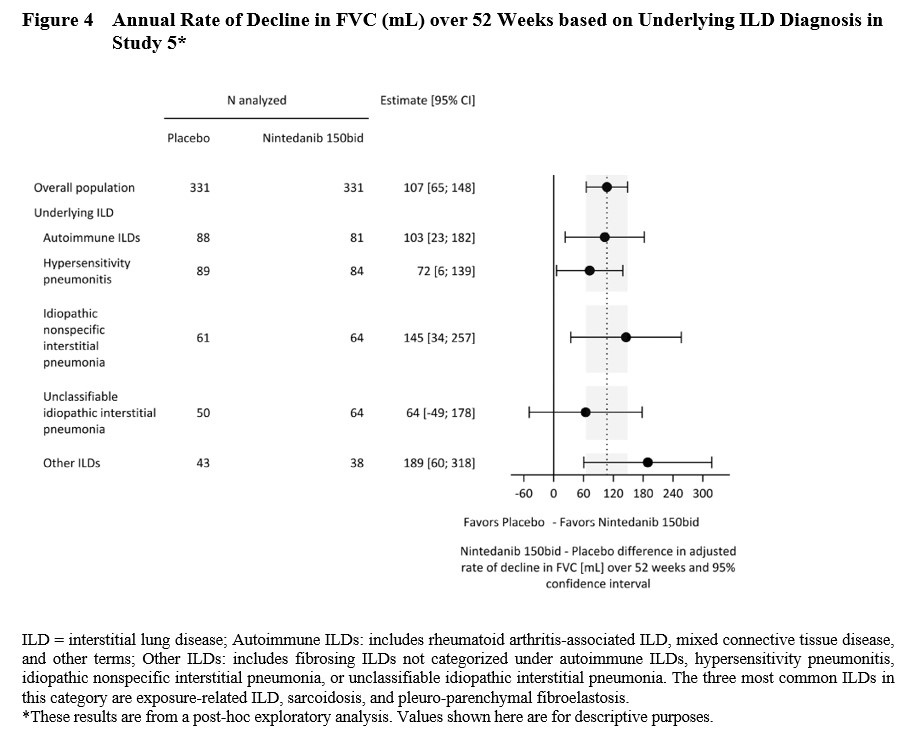
1 (Figure 4)

1 (Figure 4)
A forest plot chart illustrating the annual rate of decline in forced vital capacity (FVC) in milliliters over 52 weeks, comparing placebo and Nintedanib 150 mg twice daily based on underlying interstitial lung disease (ILD) diagnosis from Study 5. The chart displays population subgroups including autoimmune ILDs, hypersensitivity pneumonitis, idiopathic nonspecific interstitial pneumonia, unclassifiable idiopathic interstitial pneumonia, and other ILDs with corresponding estimates and 95% confidence intervals.*
FDA Label Image

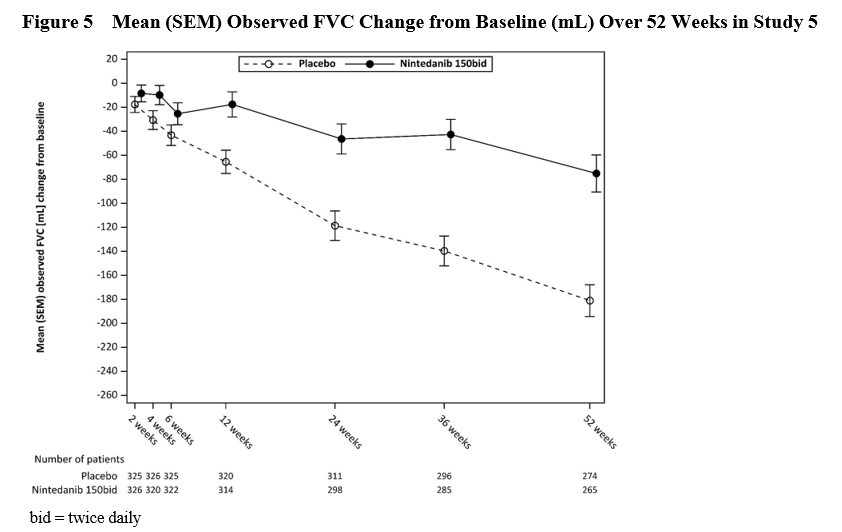
1 (Figure 5)

1 (Figure 5)
A line graph titled 'Mean (SEM) Observed FVC Change from Baseline (mL) Over 52 Weeks in Study 5' comparing FVC changes between placebo and Nintedanib 150 mg twice daily. The x-axis shows time points from 2 to 52 weeks, and the y-axis shows mean FVC change in mL from baseline. Placebo is represented by a dashed line with open circles, and Nintedanib 150 mg bid by a solid line with filled circles. Data points include SEM error bars.*
FDA Label Image

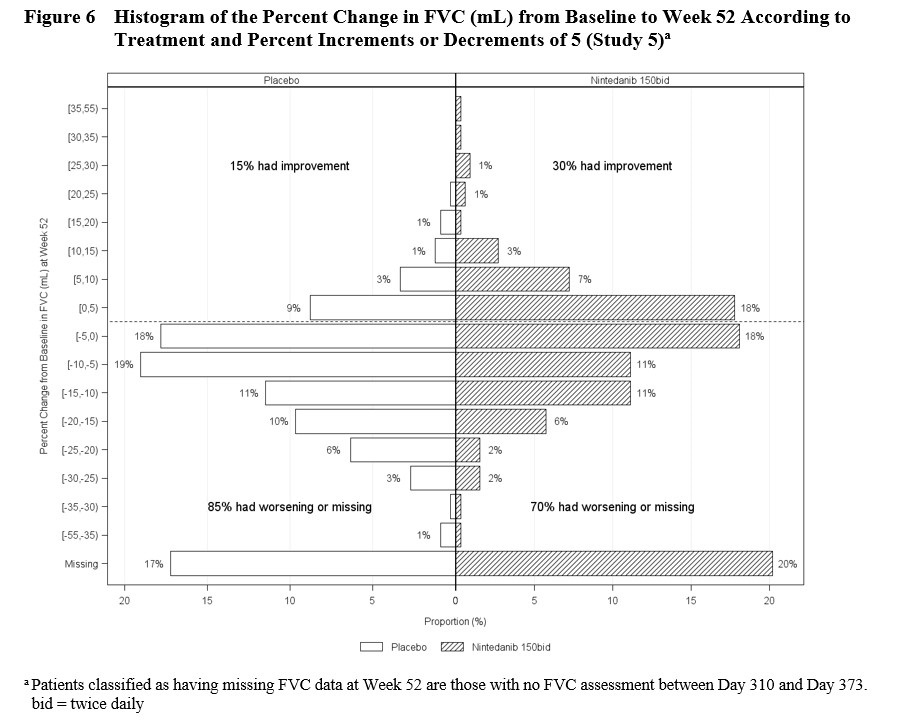
1 (Figure 6)

1 (Figure 6)
Histogram showing the percent change in forced vital capacity (FVC) in milliliters from baseline to Week 52 in a clinical study comparing placebo and Nintedanib 150 mg taken twice daily. The chart illustrates proportions of patients with improvement, worsening, or missing data, segmented by 5% increments of change in FVC, with annotations of percentages who had improvement or worsening/missing data in each group.*
FDA Label Image

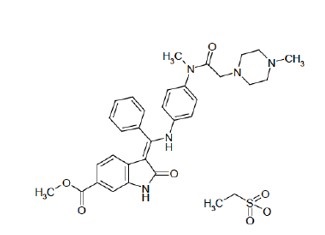
1 (Nintedanib Esylate)

1 (Nintedanib Esylate)
Chemical structure of the active ingredient nintedanib, showing its molecular framework with various aromatic rings and functional groups.*
FDA Label Image

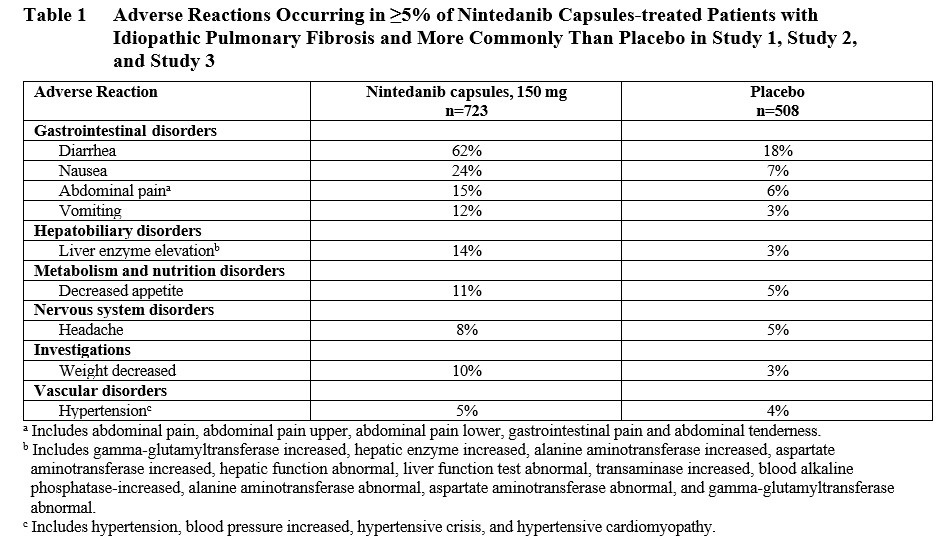
1 (Table 1)

1 (Table 1)
Table listing adverse reactions occurring in 5% or more of patients treated with Nintedanib capsules 150 mg compared to placebo, from studies on idiopathic pulmonary fibrosis. Reactions include gastrointestinal disorders such as diarrhea (62% vs 18%), nausea (24% vs 7%), abdominal pain (15% vs 6%), and vomiting (12% vs 3%). Hepatobiliary disorders show liver enzyme elevation at 14% versus 3%. Other reactions include decreased appetite, headache, weight decreased, and hypertension.*
FDA Label Image

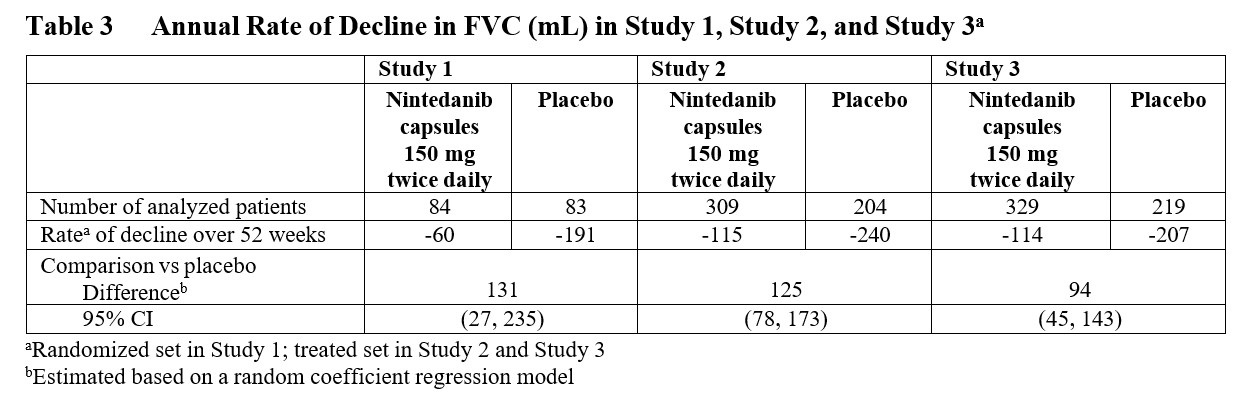
1 (Table 3)

1 (Table 3)
Data table titled 'Annual Rate of Decline in FVC (mL) in Study 1, Study 2, and Study 3' comparing Nintedanib capsules 150 mg twice daily versus placebo. The table presents patient numbers, decline rates over 52 weeks, and comparison differences with 95% confidence intervals for three studies.*
FDA Label Image

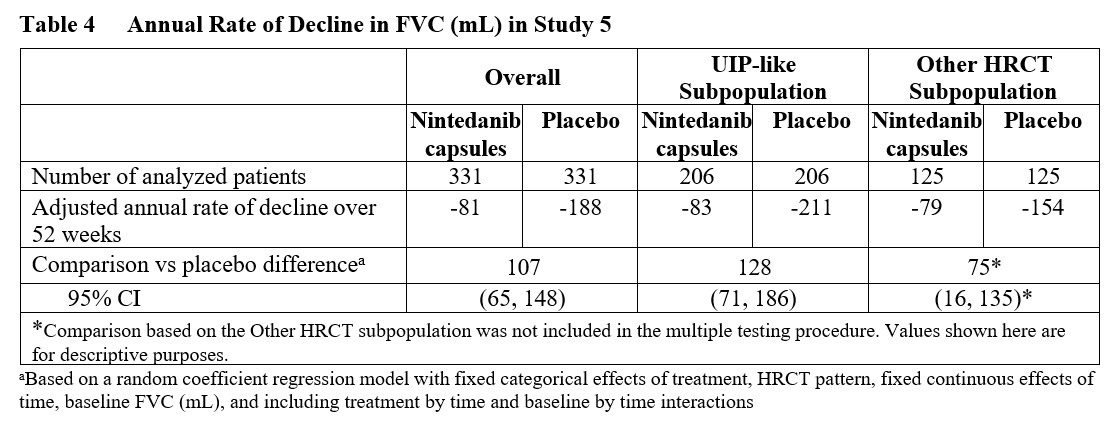
1 (Table 4)

1 (Table 4)
Table showing the annual rate of decline in forced vital capacity (FVC, mL) in Study 5, comparing nintedanib capsules versus placebo across overall, UIP-like subpopulation, and other HRCT subpopulation groups. The table includes number of patients analyzed, adjusted annual rate of decline over 52 weeks, comparison versus placebo difference with 95% confidence intervals, and notes on statistical analysis.*

* About these descriptions: Image descriptions on this page are generated by automated AI analysis of the product label images from the manufacturer's FDA label submission (SPL). They are provided for reference only and may contain errors or omissions. Always rely on the printed label itself and the official FDA labeling, and consult a pharmacist or healthcare professional with any questions about this product.