Doxazosin Tablet
Product Images NDC 51655-130

View Photos of Packaging, Regulatory Labels, and Product Appearance

Product Visual Gallery

This gallery contains 4 technical images submitted to the FDA as part of the official labeling for Doxazosin (NDC 51655-130). Unlike standard consumer photos, these assets often include clinical data figures, molecular chemical structures, and official manufacturer packaging layouts.

As provided by Northwind Health Company, Llc, these visuals offer a comprehensive scientific overview of the product's physical and chemical identity, aiding pharmacists and researchers in product verification and study.

FDA Label Image

Label (51655 130 52 Rev A 02 23)
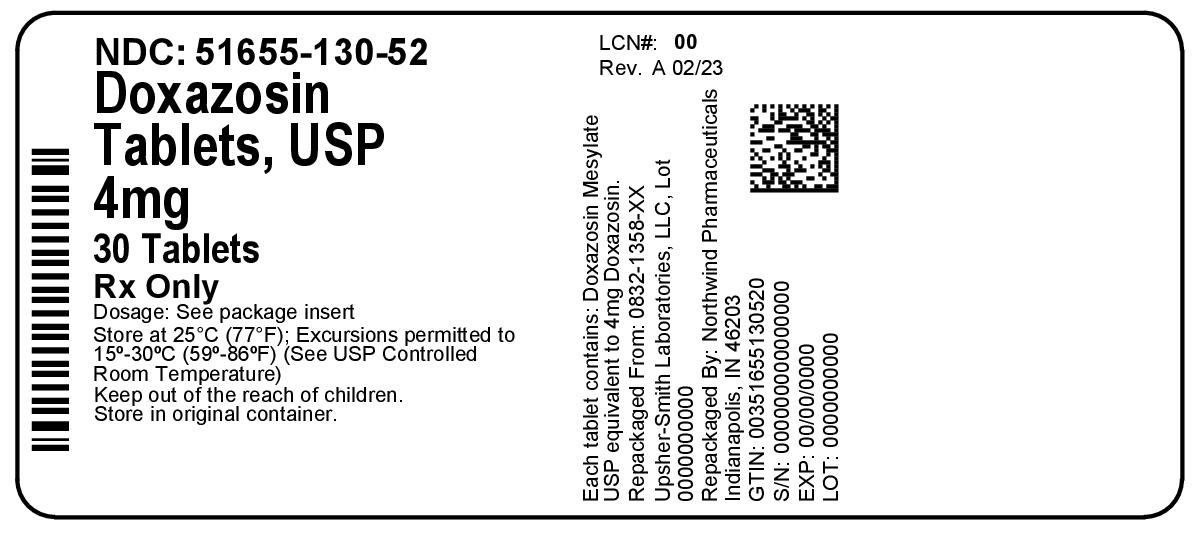
Label (51655 130 52   Rev A 02 23)
Label for Doxazosin Tablets, USP 4 mg, containing 30 tablets for oral use. The label states the product is prescription only and includes storage instructions. It is repackaged by Northwind Pharmaceuticals in Indianapolis, IN. The label also shows NDC 51655-130-52 and dosage information advising to see the package insert.*
FDA Label Image

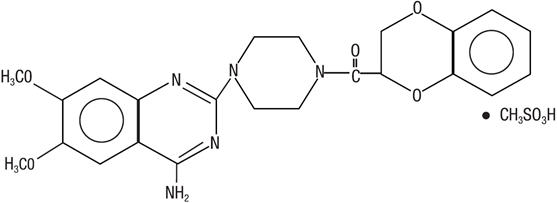
Chemical Structure (Doxazosin 01)

Chemical Structure (Doxazosin 01)
Chemical structure of doxazosin mesylate, showing its molecular framework with characteristic rings and functional groups, including methoxy and amine groups as part of the compound's structure.*
FDA Label Image

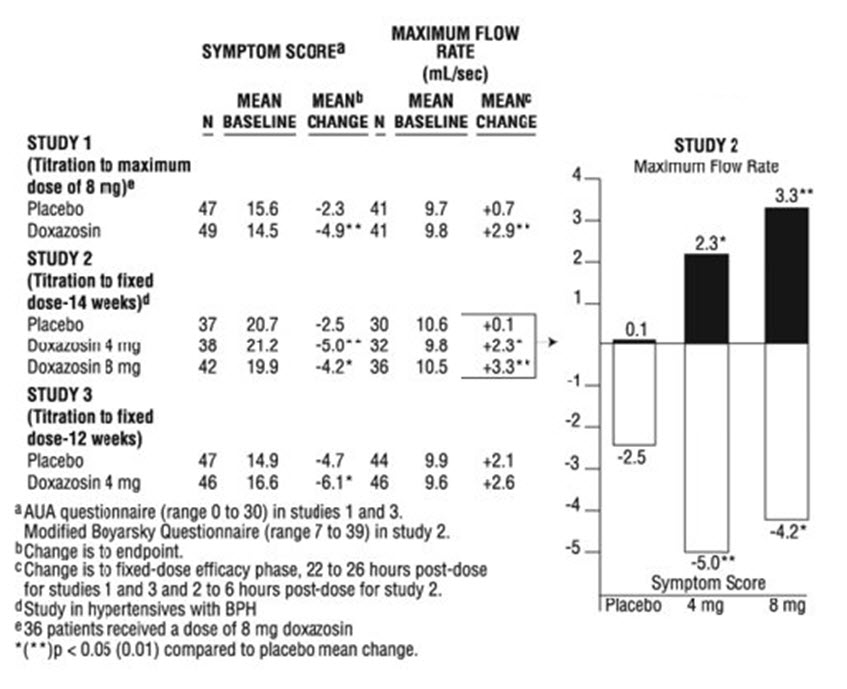
Table 3 (Doxazosin 02)

Table 3 (Doxazosin 02)
A data table and bar graph presenting results from three clinical studies evaluating symptom score and maximum flow rate changes with placebo versus doxazosin doses, including 4 mg and 8 mg. The table shows mean baseline and mean change values for symptom scores and maximum flow rates, while the bar graph highlights maximum flow rate increases and symptom score decreases in Study 2 at different dosages.*
FDA Label Image

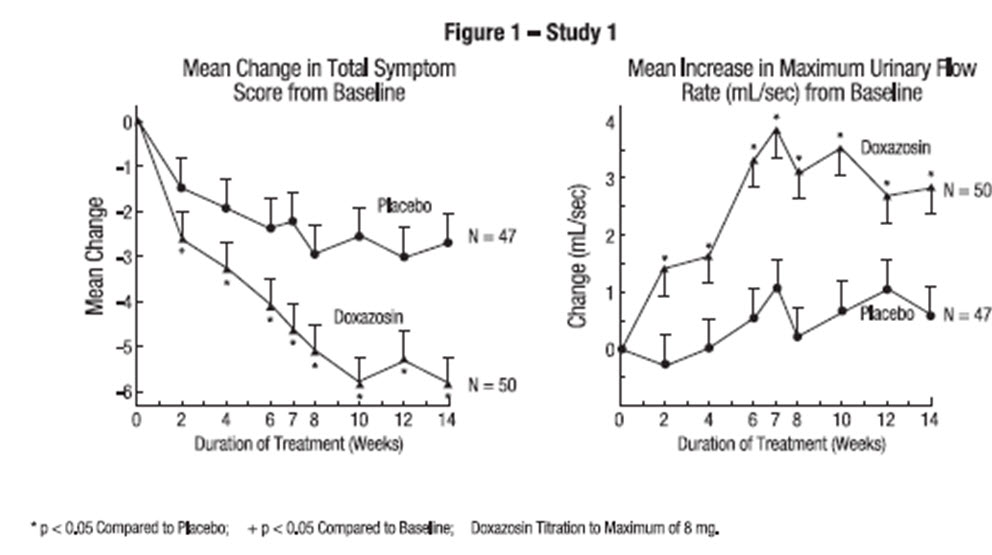
Figure 1 (Doxazosin 03)

Figure 1 (Doxazosin 03)
A figure showing two line graphs from a clinical study of Doxazosin. The left graph depicts mean change in total symptom score from baseline over 14 weeks for Doxazosin and placebo groups. The right graph shows mean increase in maximum urinary flow rate (mL/sec) from baseline over 14 weeks for both groups. The data highlights differences in treatment effect between Doxazosin and placebo.*

* About these descriptions: Image descriptions on this page are generated by automated AI analysis of the product label images from the manufacturer's FDA label submission (SPL). They are provided for reference only and may contain errors or omissions. Always rely on the printed label itself and the official FDA labeling, and consult a pharmacist or healthcare professional with any questions about this product.