Atorvastatin Calcium Tablet, Film Coated
Product Images NDC 51655-464

View Photos of Packaging, Regulatory Labels, and Product Appearance

Product Visual Gallery

This gallery contains 5 technical images submitted to the FDA as part of the official labeling for Atorvastatin Calcium (NDC 51655-464). Unlike standard consumer photos, these assets often include clinical data figures, molecular chemical structures, and official manufacturer packaging layouts.

As provided by Northwind Health Company, Llc, these visuals offer a comprehensive scientific overview of the product's physical and chemical identity, aiding pharmacists and researchers in product verification and study.

FDA Label Image

Label (51655 464 52 Master Bottle Label Approval Rev A 10 20)

Label (51655 464 52 Master Bottle Label Approval   Rev A 10 20)
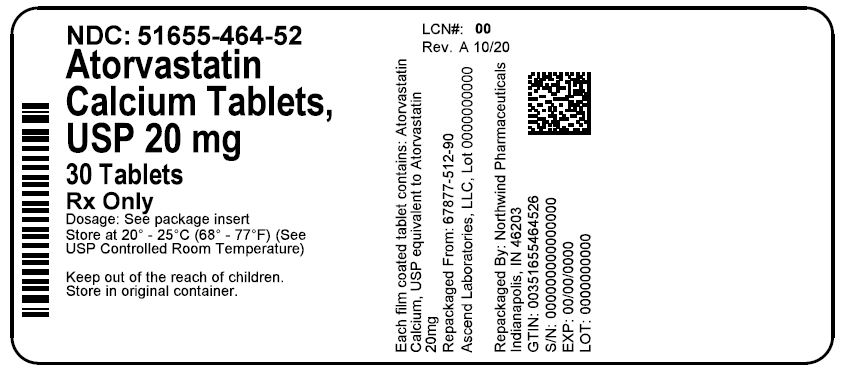
This is a description of Atorvastatin Calcium Tablets in a package of 30, with a dosage that can be found in the package insert. The tablets contain 20mg of Atorvastatin Calcium, and should be stored at controlled room temperature. The package has information on the drug's NDC, GTIN, serial number, lot number, and expiration date. The package was repackaged by Northwind Pharmaceuticals in Indianapolis. However, the text may appear unclear and difficult to read for .*
FDA Label Image

Atorvastatin-fig-1 (Atorvastatin Fig 1)

Atorvastatin-fig-1 (Atorvastatin Fig 1)
This appears to be a graph showing the cumulative incidence of a certain event (%), with the x-axis representing years and the y-axis representing the percentage of cumulative incidence. Two lines are shown, one for Atorvastatin and the other for Placebo. The graph also includes the hazard ratio and p-value. No further information is available.*
FDA Label Image

Atorvastatin-fig-2 (Atorvastatin Fig 2)

Atorvastatin-fig-2 (Atorvastatin Fig 2)
This is a plot showing cumulative hazard over four years of follow-up for two treatments, placebo and atorvastatin. The hazard ratio (HR) between the two treatments is 0.63 with a 95% confidence interval of 0.48-0.83, and a p-value of 0.001, indicating a statistically significant difference between the two treatments. The x-axis shows the time to the first primary endpoint, with values ranging from 1 to 5 years.*
FDA Label Image

Atorvastatin-fig-3 (Atorvastatin Fig 3)

Atorvastatin-fig-3 (Atorvastatin Fig 3)
This text is a table that shows the percentage of subjects experiencing a major cardiovascular endpoint over time while taking Atorvastatin 10 mg and 80 mg. The table also displays a hazard ratio of 0.78 at 80 mg.*
FDA Label Image

Atorvastatin-st (Atorvastatin St)

* These product label images have been analyzed using experimental machine learning. Please verify findings with the primary label text.