Product Images Tadalafil

View Photos of Packaging, Labels & Appearance

Product Label Images

The following 10 images provide visual information about the product associated with Tadalafil NDC 51655-473 by Northwind Pharmaceuticals, Llc, such as packaging, labeling, and the appearance of the drug itself. This resource could be helpful for medical professionals, pharmacists, and patients seeking to verify medication information and ensure they have the correct product.

Label - 51655 473 54

Label - 51655 473 54

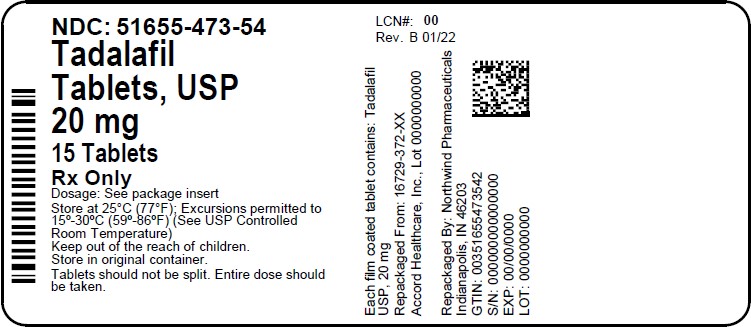
This is a description of a medication called Tadalafil. The tablets contain 20mg of Tadalafil USP and come in a package of 15. They should be stored at room temperature, away from children, in their original container. The tablets are film-coated and should not be split. The NDC number is 516ยง5-473-54 and the repackager is Northwind Pharmaceuticals. Along with the manufacturer's information, are details including the LCN number, lot number, and expiration date of the medication. The GTIN number is 0351655473542. The medication is only available with a prescription.*

Figure - tadalafil figure1

Figure - tadalafil figure1

This is a table that shows the difference in blood pressure (mmHg) between Tadalafil and Placebo. It includes measurements of standing systolic and diastolic BP, as well as supine systolic and diastolic BP, at different time intervals.*

Figure - tadalafil figure2

Figure - tadalafil figure2

The text seems to be a mixture of numerical data and some characters that may represent currency symbols, chemical names, or mathematical functions. It is not clear without further context what this information refers to, but it seems to involve some sort of experiment involving different treatments and their effects over time. Thus, a useful description of this text cannot be generated.*

Figure - tadalafil figure3

Figure - tadalafil figure3

The text represents a chart showing the changes in systolic blood pressure (measured in mmHg) over time after administration of different medications (20 mg tadalafil and/or 8 mg qd doxazosin) or placebo. The chart indicates the time of administration (08:00 or 20:00) for each medication or placebo.*

Figure - tadalafil figure4

Figure - tadalafil figure4

This is a graph displaying the plasma concentration of Tadalafil (in ug/L) over time (in hours) after administering different doses. The doses are a single 20-mg dose, a single 5-mg dose, and once-daily 5-mg dose for 5 consecutive days. The graph shows that the concentration of Tadalafil increases quickly after taking the drug and then gradually decreases over time. The highest concentration is achieved with the single 20-mg dose.*

Figure 5 - tadalafil figure5

Figure 5 - tadalafil figure5

The text describes the change from baseline in IPSS total score during a certain duration of treatment using tadalafils mg and a placebo. There was a statistically significant difference between the two, with the tadalafils mg group showing a greater improvement in scores. The duration of treatment was up to 12 weeks.*

Figure 6 - tadalafil figure6

Figure 6 - tadalafil figure6

Figure 7 - tadalafil figure7

Figure 7 - tadalafil figure7

Figure 8 - tadalafil figure8

Figure 8 - tadalafil figure8

Chemical Structure - tadalafil structure

Chemical Structure - tadalafil structure

* The product label images have been analyzed using a combination of traditional computing and machine learning techniques. It should be noted that the descriptions provided may not be entirely accurate as they are experimental in nature. Use the information in this page at your own discretion and risk.