Rosuvastatin Calcium Tablet, Coated
Product Images NDC 51655-756

13 FDA label images from Northwind Health Company, Llc · Packaging, Regulatory Labels, and Product Appearance

Product Visual Gallery

This gallery contains 13 technical images submitted to the FDA as part of the official labeling for Rosuvastatin Calcium (NDC 51655-756). Unlike standard consumer photos, these assets often include clinical data figures, molecular chemical structures, and official manufacturer packaging layouts.

As provided by Northwind Health Company, Llc, these visuals offer a comprehensive scientific overview of the product's physical and chemical identity, aiding pharmacists and researchers in product verification and study.

FDA Label Image

Structure (Image Structure)

Structure (Image Structure)
Chemical structure of Rosuvastatin Calcium showing its molecular components, including aromatic rings, hydroxyl groups, and the calcium ion (Ca2+) complex associated with the molecule.*
FDA Label Image

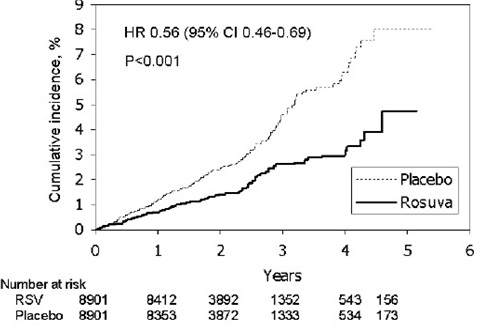
Figure 1 (Rosuvastatin Figure 1)

Figure 1 (Rosuvastatin Figure 1)
A line graph showing cumulative incidence percentage over 5 years comparing Rosuva (rosuvastatin calcium) and placebo groups. The graph includes hazard ratio (HR 0.56) with 95% confidence interval (0.46-0.69) and p-value (<0.001). The number of subjects at risk is indicated at multiple time points for both groups.*
FDA Label Image

Figure 2 (Rosuvastatin Figure 2)

Figure 2 (Rosuvastatin Figure 2)
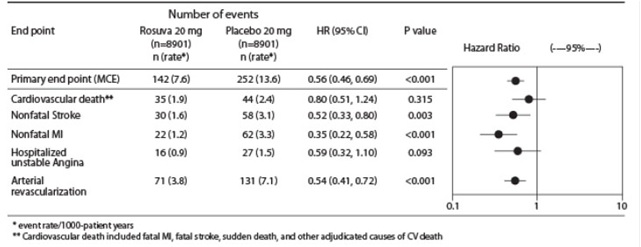
A forest plot chart showing hazard ratios (HR) with 95% confidence intervals for various cardiovascular endpoints comparing Rosuvastatin Calcium 20 mg to placebo 20 mg. The endpoints include primary end point, cardiovascular death, nonfatal stroke, nonfatal myocardial infarction, hospitalized unstable angina, and arterial revascularization. The chart includes number of events, hazard ratios, P values, and visual markers of effect size and confidence intervals.*
FDA Label Image

Table 10 (Table 10)

Table 10 (Table 10)
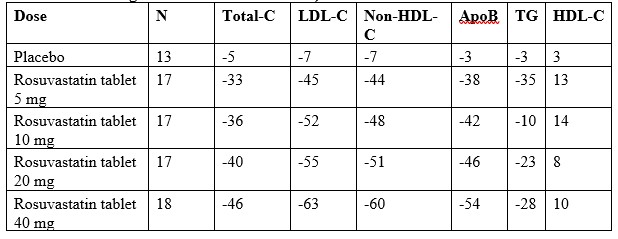
A data table showing lipid profile measurements by dose groups including Placebo and Rosuvastatin tablets at 5 mg, 10 mg, 20 mg, and 40 mg. Parameters listed are N (sample size), Total-C, LDL-C, Non-HDL-C, ApoB, TG, and HDL-C, with numerical values indicating changes for each group.*
FDA Label Image

Figure 3 (Rosuvastatin Figure 3)

Figure 3 (Rosuvastatin Figure 3)
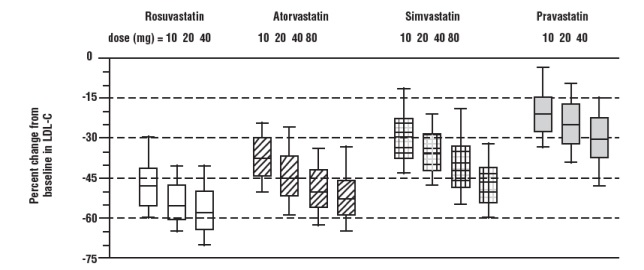
A box plot chart comparing percent change from baseline in LDL-C for four statins: Rosuvastatin, Atorvastatin, Simvastatin, and Pravastatin. Different doses (mg) are shown for each statin across the x-axis, with percent change ranging on the y-axis from 0 to -75. The chart visually represents variations in LDL-C reduction by dose for each drug.*
FDA Label Image

Table 11 (Table 11)

Table 11 (Table 11)
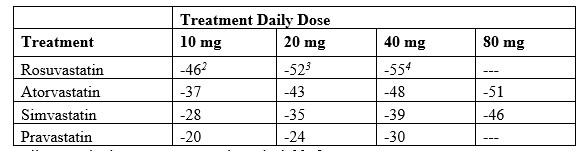
A data table presenting treatment daily doses of Rosuvastatin, Atorvastatin, Simvastatin, and Pravastatin at 10 mg, 20 mg, 40 mg, and 80 mg levels. It shows numerical dose values across these statins with some missing entries noted by dashes.*
FDA Label Image

Table 12 (Table 12)

Table 12 (Table 12)
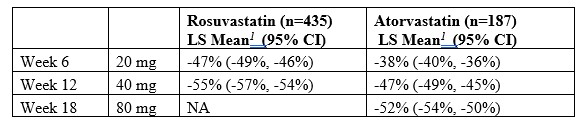
A data table comparing the least squares (LS) mean percentage changes and 95% confidence intervals (CI) of two drugs, Rosuvastatin and Atorvastatin, across weeks 6, 12, and 18 at varying dosages (20 mg, 40 mg, 80 mg). The table includes sample sizes for each drug group and notes missing data for Rosuvastatin at week 18 with 80 mg.*
FDA Label Image

Table 13 (Table 13)

Table 13 (Table 13)
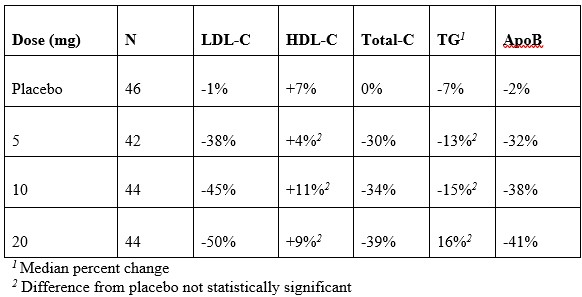
A data table displaying median percent changes in various lipid and apolipoprotein levels (LDL-C, HDL-C, Total-C, TG, ApoB) across different rosuvastatin calcium doses (placebo, 5 mg, 10 mg, 20 mg). The table includes sample sizes (N) and notes on statistical significance for differences from placebo.*
FDA Label Image

Table 15 (Table 15)

Table 15 (Table 15)
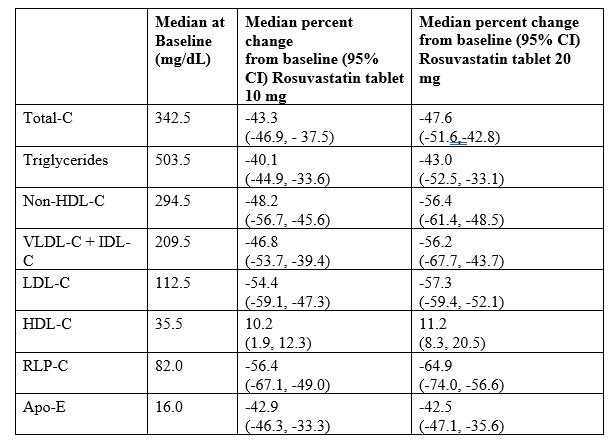
A data table displaying median baseline values and median percent changes from baseline with 95% confidence intervals for various lipid components. The table compares results for Rosuvastatin Calcium tablets at 10 mg and 20 mg doses including Total-C, Triglycerides, Non-HDL-C, VLDL-C + IDL-C, LDL-C, HDL-C, RLP-C, and Apo-E.*
FDA Label Image

Table 16 (Table 16)

Table 16 (Table 16)
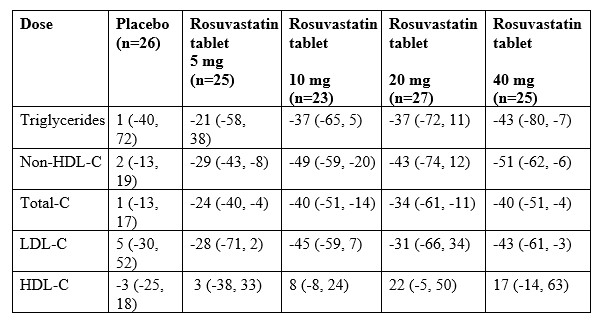
A data table showing lipid parameter changes by dose group for placebo and various strengths of Rosuvastatin tablets (5 mg, 10 mg, 20 mg, 40 mg). The table compares effects on Triglycerides, Non-HDL-C, Total-C, LDL-C, and HDL-C with sample sizes for each group listed.*
FDA Label Image
FDA Label Image
FDA Label Image

Label (51655 756 52 Rev A 07 21 Nhc)

Label (51655 756 52   Rev A 07 21 Nhc)
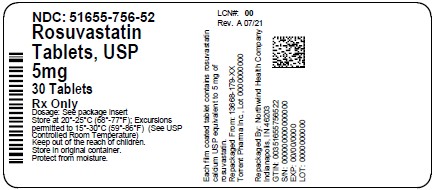
Rosuvastatin calcium 5 mg coated tablets packaging label. The label states a quantity of 30 tablets, with storage instructions and a prescription-only indication. Distributed by Northwind Health Company, LLC. Includes NDC 51655-756-52 and barcode information.*

* About these descriptions: Image descriptions on this page are generated by automated AI analysis of the product label images from the manufacturer's FDA label submission (SPL). They are provided for reference only and may contain errors or omissions. Always rely on the printed label itself and the official FDA labeling, and consult a pharmacist or healthcare professional with any questions about this product.