Sildenafil Citrate Tablet, Film Coated
Product Images NDC 51655-793

View Photos of Packaging, Regulatory Labels, and Product Appearance

Product Visual Gallery

This gallery contains 9 technical images submitted to the FDA as part of the official labeling for Sildenafil Citrate (NDC 51655-793). Unlike standard consumer photos, these assets often include clinical data figures, molecular chemical structures, and official manufacturer packaging layouts.

As provided by Northwind Health Company, Llc, these visuals offer a comprehensive scientific overview of the product's physical and chemical identity, aiding pharmacists and researchers in product verification and study.

FDA Label Image

Label (51655 793 20 Master Bottle Label Approval Rev A 01 22)
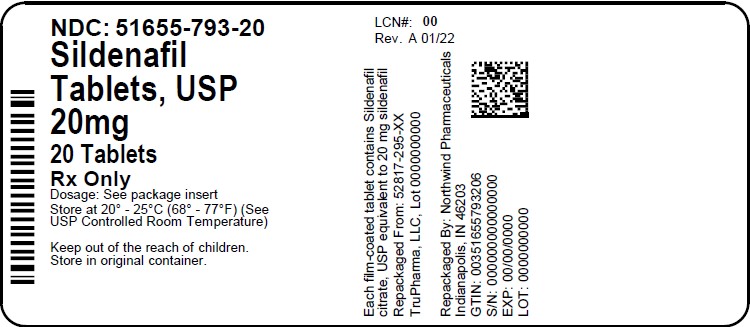
Label (51655 793 20 Master Bottle Label Approval   Rev A 01 22)
Sildenafil Tablets USP 20 mg film-coated oral tablets packaging label. The label indicates 20 tablets per container, prescription only, storage instructions at controlled room temperature, and safety warnings to keep out of reach of children. Labeler is Northwind Pharmaceuticals, with NDC 51655-793-20 visible.*
FDA Label Image

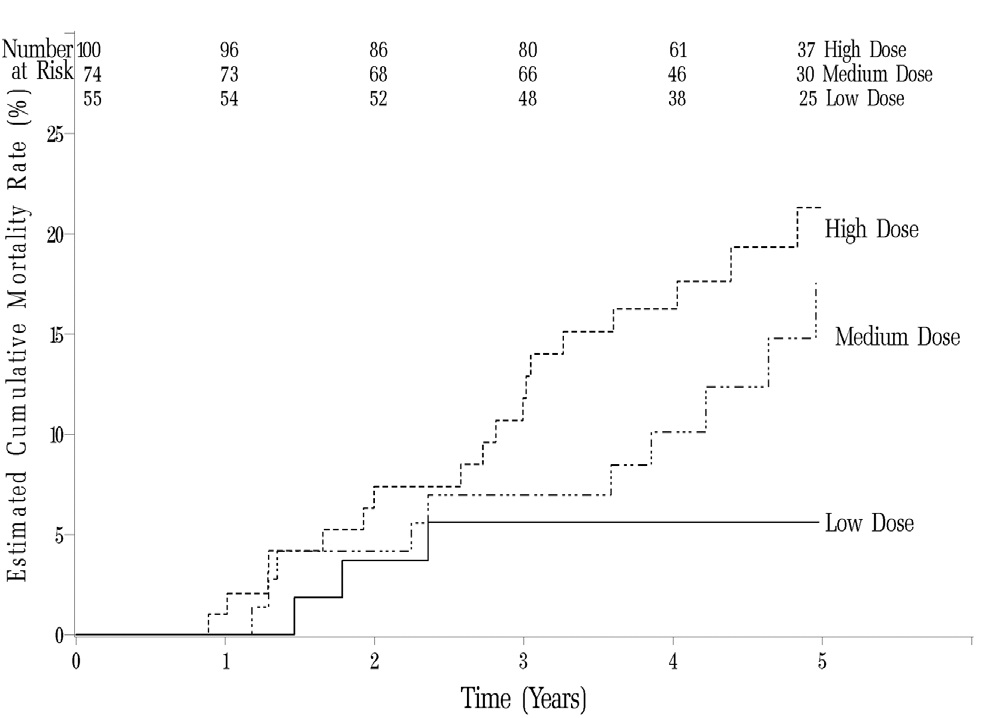
Graph (Sildenafil Tablets Usp 20mg Figure 06)

Graph (Sildenafil Tablets Usp 20mg Figure 06)
A line chart showing estimated cumulative mortality rate (%) over a 5-year period for three dose groups labeled High Dose, Medium Dose, and Low Dose. The chart includes a number-at-risk table above the x-axis with decreasing counts over time for each dose group. The plot uses step lines to represent mortality rates for each group distinctly.*
FDA Label Image

Graph (Sildenafil Tablets Usp 20mg Figure 07)

Graph (Sildenafil Tablets Usp 20mg Figure 07)
A chart showing fold change and 90% confidence intervals for pharmacokinetic parameters (AUC, Cmax) of sildenafil when coadministered with various interacting drugs, including Atorvastatin, Azithromycin, Bosentan, Cimetidine, Erythromycin, Maalox, Oral Contraceptives, Ritonavir, and Saquinavir, along with dosing recommendations based on the interaction data.*
FDA Label Image

Graph (Sildenafil Tablets Usp 20mg Figure 08)

Graph (Sildenafil Tablets Usp 20mg Figure 08)
A chart displaying fold change and 90% confidence intervals for various interacting drugs with sildenafil, showing parameters such as AUC, Cmax, INR, and bleeding time. The x-axis represents change relative to the interacting drug alone, with a vertical solid line at 1. Recommendations regarding dose adjustment are provided, mostly indicating no dose adjustment except for ritonavir, for which coadministration is not recommended.*
FDA Label Image

Graph (Sildenafil Tablets Usp 20mg Figure 09)

Graph (Sildenafil Tablets Usp 20mg Figure 09)
A line graph showing change from baseline in meters over Weeks 4, 8, and 12 of a study. The x-axis represents the 'Week of Study' and the y-axis shows 'Change from Baseline (meters)'. Four series are plotted: Placebo, Sildenafil 20mg TID, Sildenafil 40mg TID, and Sildenafil 80mg TID, each with error bars indicating variability. The graph visually compares the exercise distance improvement across different doses of sildenafil and placebo over time.*
FDA Label Image

Graph (Sildenafil Tablets Usp 20mg Figure 10)

Graph (Sildenafil Tablets Usp 20mg Figure 10)
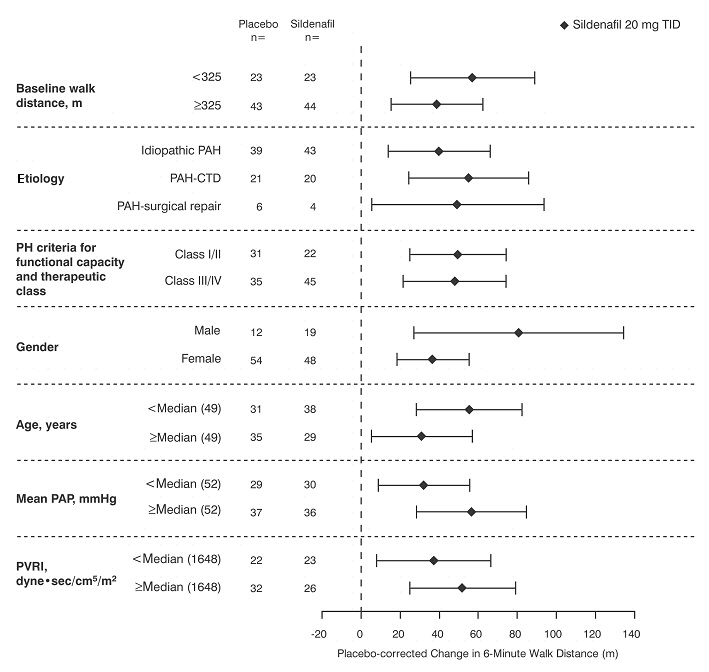
A forest plot chart showing the placebo-corrected change in 6-minute walk distance (meters) comparing Sildenafil 20 mg TID with placebo. The chart stratifies data by baseline walk distance, etiology, PH functional class, gender, age, mean pulmonary arterial pressure (PAP), and pulmonary vascular resistance index (PVRI), with error bars representing confidence intervals for each subgroup.*
FDA Label Image

Graph (Sildenafil Tablets Usp 20mg Figure 11)

Graph (Sildenafil Tablets Usp 20mg Figure 11)
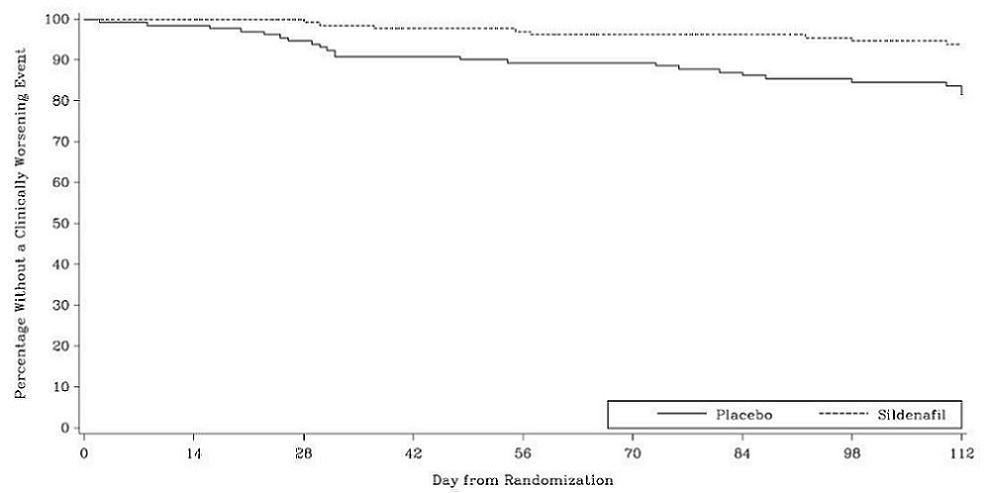
A survival curve chart comparing the percentage of patients without a clinically worsening event over time between placebo and sildenafil groups. The x-axis represents days from randomization (0 to 112), and the y-axis shows the percentage without worsening events (0 to 100%). Two lines depict the data: a dashed line for sildenafil and a solid line for placebo, with sildenafil maintaining a higher percentage throughout.*
FDA Label Image

Graph (Sildenafil Tablets Usp 20mg Figure 12)

Graph (Sildenafil Tablets Usp 20mg Figure 12)
A line graph depicting the mean change from baseline in meters over a 12-week study period for sildenafil doses 1 mg, 5 mg, and 20 mg taken three times daily (TID). The graph shows data points with error bars at weeks 4, 8, and 12, indicating the variability of each treatment's effect over time.*
FDA Label Image

Structure Formula (Sildenafil Tablets Usp 20mg Structure)

Structure Formula (Sildenafil Tablets Usp 20mg Structure)
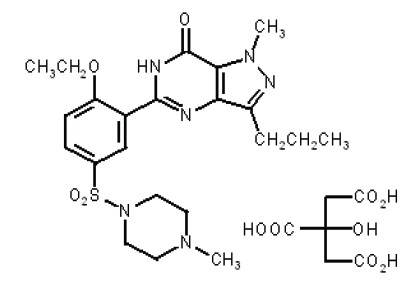
Chemical structure diagram of Sildenafil, depicting its molecular formula with functional groups and ring structures, consistent with the active ingredient in Sildenafil Citrate tablets.*

* About these descriptions: Image descriptions on this page are generated by automated AI analysis of the product label images from the manufacturer's FDA label submission (SPL). They are provided for reference only and may contain errors or omissions. Always rely on the printed label itself and the official FDA labeling, and consult a pharmacist or healthcare professional with any questions about this product.