Tamsulosin Hydrochloride Capsule
Product Images NDC 51655-832

View Photos of Packaging, Regulatory Labels, and Product Appearance

Product Visual Gallery

This gallery contains 7 technical images submitted to the FDA as part of the official labeling for Tamsulosin Hydrochloride (NDC 51655-832). Unlike standard consumer photos, these assets often include clinical data figures, molecular chemical structures, and official manufacturer packaging layouts.

As provided by Northwind Health Company, Llc, these visuals offer a comprehensive scientific overview of the product's physical and chemical identity, aiding pharmacists and researchers in product verification and study.

FDA Label Image

Label (51655 832 52 Master Bottle Label Approval Rev A 02 22)

Label (51655 832 52 Master Bottle Label Approval   Rev A 02 22)
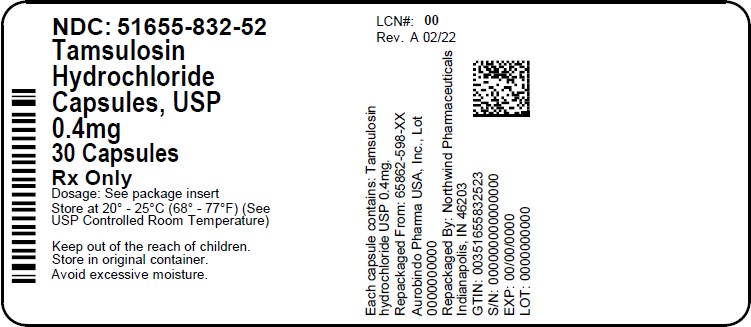
This is a prescription medicine called Tamsulosin Hydrochloride Capsules, USP 0.4mg with NDC number 51655-832-52. It comes in 30 capsules and should be stored at room temperature. The capsule contains Tamsulosin Hydrochloride USP 0.4mg. The medicine is repackaged by Northwind Pharmaceticals from Aurobindo Pharma USA, Inc., Lot 0000000000. The GTIN is 0035165832523, the S/N is 000000000000000. The expiration date is 00/00/0000 and the lot number is 0000000000. It is important to keep the medicine out of reach of children and store in the original container to avoid excessive moisture. Please see package insert for dosage information.*
FDA Label Image

Figure 1 Mean Plasma Tamsulosin Hydrochloride Concentrations Following Single-dose Administration Of Tamsulosin Hydrochloride Capsules 0.4 mg Under Fasted And Fed Conditions (n=8) (Tamsulosin Fig1)

Figure 1 Mean Plasma Tamsulosin Hydrochloride Concentrations Following Single-dose Administration Of Tamsulosin Hydrochloride Capsules 0.4 mg Under Fasted And Fed Conditions (n=8) (Tamsulosin Fig1)
This appears to be a figure with a graph showing the mean plasma concentrations of Tamsulosin Hydrochloride after being administered a single dose of 0.4mg under fasted and fed conditions. The graph shows the concentrations at different time intervals (in hours) for both fasted and fed conditions. No further information is available from this text.*
FDA Label Image

Figure 2a Mean Change From Baseline In Total Aua Symptom Score (0 To 35) Study 1 (Tamsulosin Fig2)

FDA Label Image

Figure 2b Mean Change From Baseline In Total Aua Symptom Score (0 To 35) Study 2 (Tamsulosin Fig3)

FDA Label Image

Figure 3a Mean Increase In Peak Urine Flow Rate (ml/sec) Study 1 (Tamsulosin Fig4)

Figure 3a Mean Increase In Peak Urine Flow Rate (ml/sec) Study 1 (Tamsulosin Fig4)
The image displays a graph labeled 'Figure 3A' that describes the average increase in peak urine flow rate in L/Sec in Study 1. The graph compares three treatment options: 0.08mg, A=2x 0.4mg, and placebo. The x-axis shows the duration of treatment in weeks, and the y-axis shows the mean change in mL/sec. The graph shows that both the treatment options yield a higher mean change in mL/sec than the placebo. The number of participants in each group is given in parentheses next to each data point.*
FDA Label Image

Figure 3b Mean Increase In Peak Urine Flow Rate (ml/sec) Study 2 (Tamsulosin Fig5)

FDA Label Image

Chemical Structure (Tamsulosin Str)

* These product label images have been analyzed using experimental machine learning. Please verify findings with the primary label text.