Carvedilol Tablet, Film Coated
Product Images NDC 51655-943

View Photos of Packaging, Regulatory Labels, and Product Appearance

Product Visual Gallery

This gallery contains 6 technical images submitted to the FDA as part of the official labeling for Carvedilol (NDC 51655-943). Unlike standard consumer photos, these assets often include clinical data figures, molecular chemical structures, and official manufacturer packaging layouts.

As provided by Northwind Health Company, Llc, these visuals offer a comprehensive scientific overview of the product's physical and chemical identity, aiding pharmacists and researchers in product verification and study.

FDA Label Image

Label (51655 943 18 Master Bottle Label Approval Rev A 03 22)
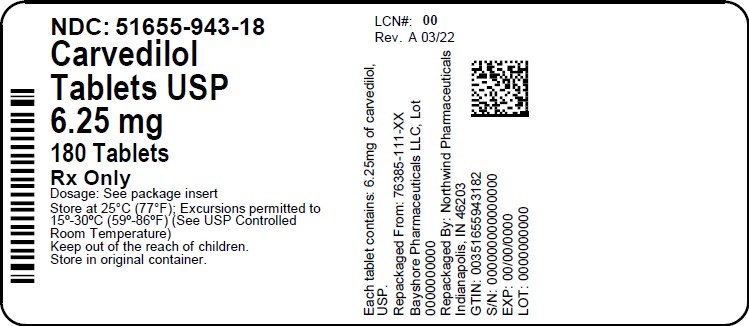
Label (51655 943 18 Master Bottle Label Approval   Rev A 03 22)
Carvedilol Tablets USP 6.25 mg film-coated tablets, 180 count package label. The label includes storage instructions, prescription-only status, and manufacturer information specifying Northwind Pharmaceuticals and Northwind Health Company, LLC. It also displays the NDC 51655-943-18 and other regulatory details.*
FDA Label Image

Figure 1 (Figure 1)

Figure 1 (Figure 1)
A line chart comparing mortality percentages over 21 months between a placebo group and a Carvedilol-treated group. The x-axis represents time in months, and the y-axis shows percentage mortality. The Carvedilol group consistently shows lower mortality compared to placebo, with a reported p-value of 0.0014 indicating statistical significance.*
FDA Label Image

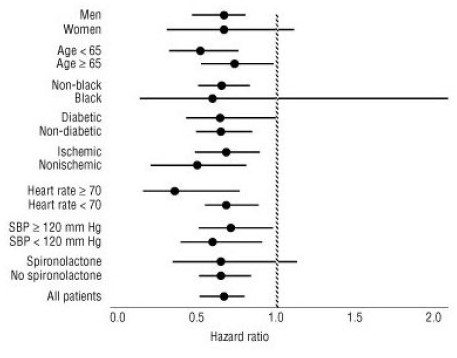
Figure 2 (Figure 2)

Figure 2 (Figure 2)
A forest plot showing hazard ratios with confidence intervals for various patient subgroups, including men, women, age groups, racial groups, diabetic status, ischemic conditions, heart rate categories, systolic blood pressure levels, and spironolactone use, as well as an overall category for all patients.*
FDA Label Image

Figure 3 (Figure 3)

Figure 3 (Figure 3)
A line graph showing percent mortality over a 24-month period comparing Carvedilol and Placebo groups. The vertical axis represents percent mortality from 0 to 30%, and the horizontal axis represents time in months from 0 to 24. The graph includes a P-value of 0.03 indicating statistical comparison between the two lines.*
FDA Label Image

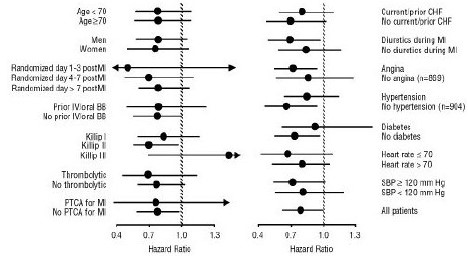
Figure 4 (Figure 4)

Figure 4 (Figure 4)
A chart displaying hazard ratios for various patient subgroups in a clinical study. The subgroups include age categories, gender, timing post myocardial infarction, prior use of intravenous beta-blockers, Killip classification, thrombolytic therapy status, percutaneous transluminal coronary angioplasty (PTCA) for myocardial infarction, congestive heart failure (CHF) history, diuretic use, angina, hypertension, diabetes, heart rate, and systolic blood pressure. Each subgroup is represented with a point estimate and confidence intervals, plotted against a hazard ratio scale from 0.4 to 1.3.*
FDA Label Image

Structural Formula (Structure)

Structural Formula (Structure)
Chemical structure diagram of Carvedilol, illustrating its molecular composition and connectivity as the active ingredient in the drug.*

* About these descriptions: Image descriptions on this page are generated by automated AI analysis of the product label images from the manufacturer's FDA label submission (SPL). They are provided for reference only and may contain errors or omissions. Always rely on the printed label itself and the official FDA labeling, and consult a pharmacist or healthcare professional with any questions about this product.