Alfuzosin Hydrochloride Tablet, Extended Release
Product Images NDC 51655-967

View Photos of Packaging, Regulatory Labels, and Product Appearance

Product Visual Gallery

This gallery contains 11 technical images submitted to the FDA as part of the official labeling for Alfuzosin Hydrochloride (NDC 51655-967). Unlike standard consumer photos, these assets often include clinical data figures, molecular chemical structures, and official manufacturer packaging layouts.

As provided by Northwind Health Company, Llc, these visuals offer a comprehensive scientific overview of the product's physical and chemical identity, aiding pharmacists and researchers in product verification and study.

FDA Label Image

51655-967-52 (51655 967 52 Rev A 06 23)

51655-967-52 (51655 967 52   Rev A 06 23)
Label for Alfuzosin Hydrochloride Extended-Release Tablets, USP 10 mg, containing 30 tablets. The label indicates the product is Rx only, with storage instructions to keep between 20°-25°C and protect from light and moisture. It is repackaged by Northwind Pharmaceuticals, Indianapolis, IN. The label includes NDC 51655-967-52 and batch information with a barcode and QR code.*
FDA Label Image

Molecular Structure (Ef35abcf E0b6 4551 84cf A689ad11e6cd 01)

Molecular Structure (Ef35abcf E0b6 4551 84cf A689ad11e6cd 01)
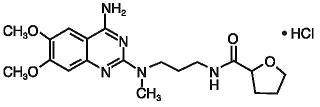
Chemical structure of Alfuzosin hydrochloride, showing its molecular arrangement including methoxy groups, amino group, and hydrochloride component.*
FDA Label Image

Figure 1 (Ef35abcf E0b6 4551 84cf A689ad11e6cd 02)

Figure 1 (Ef35abcf E0b6 4551 84cf A689ad11e6cd 02)
A line graph showing Alfuzosin plasma concentration (ng/mL) over time (hours) comparing fed and fasted states. The fed state is represented by circles and shows higher plasma levels peaking around 8 hours, while the fasted state is represented by triangles with lower concentration levels throughout the 24-hour period. Error bars indicate variability at each time point.*
FDA Label Image

Figure 2 (Ef35abcf E0b6 4551 84cf A689ad11e6cd 03)

Figure 2 (Ef35abcf E0b6 4551 84cf A689ad11e6cd 03)
A line graph comparing mean change over days of treatment between placebo and Alfuzosin hydrochloride extended-release tablets (10 mg). The x-axis represents days of treatment (0, 28, 56, 84), and the y-axis shows mean change values, with Alfuzosin showing a greater decrease compared to placebo. Statistical significance is noted at p < 0.001.*
FDA Label Image

Figure 3 (Ef35abcf E0b6 4551 84cf A689ad11e6cd 04)

Figure 3 (Ef35abcf E0b6 4551 84cf A689ad11e6cd 04)
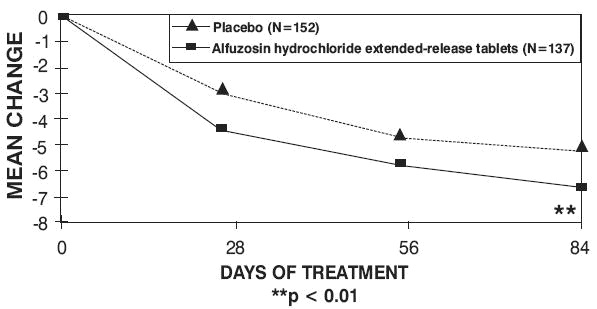
A line graph showing the mean change over 84 days of treatment comparing placebo and Alfuzosin hydrochloride extended-release tablets, with sample sizes of 152 and 137 respectively. The graph plots mean change on the vertical axis and days of treatment on the horizontal axis, indicating a larger decrease for the Alfuzosin group by day 84, with statistical significance noted at p < 0.01.*
FDA Label Image

Figure 4 (Ef35abcf E0b6 4551 84cf A689ad11e6cd 05)

Figure 4 (Ef35abcf E0b6 4551 84cf A689ad11e6cd 05)
A line graph depicting the mean change over days of treatment for Alfuzosin hydrochloride extended-release tablets versus placebo. The x-axis represents days of treatment (0, 28, 56, 84), and the y-axis shows mean change, with Alfuzosin hydrochloride showing a greater decrease over time compared to placebo. Statistical significance is indicated at day 84 with p < 0.01.*
FDA Label Image

Figure 5 (Ef35abcf E0b6 4551 84cf A689ad11e6cd 06)

Figure 5 (Ef35abcf E0b6 4551 84cf A689ad11e6cd 06)
A line graph comparing the mean change in mL/s over 84 days of treatment between placebo and Alfuzosin hydrochloride extended-release tablets. The x-axis represents days of treatment (0, 28, 56, 84) and the y-axis shows mean change in mL/s from 0 to 3. Alfuzosin shows a significant increase compared to placebo, with significance indicated at day 84 (p < 0.001).*
FDA Label Image

Figure 6 (Ef35abcf E0b6 4551 84cf A689ad11e6cd 07)

Figure 6 (Ef35abcf E0b6 4551 84cf A689ad11e6cd 07)
A line graph showing mean change in mL/s over 84 days of treatment comparing Alfuzosin hydrochloride extended-release tablets (10 mg) to placebo. The graph plots mean change on the y-axis and days of treatment on the x-axis, indicating greater improvement with Alfuzosin hydrochloride compared to placebo over time, with statistical significance noted at day 84 (p < 0.05).*
FDA Label Image

Figure 7 (Ef35abcf E0b6 4551 84cf A689ad11e6cd 08)

Figure 7 (Ef35abcf E0b6 4551 84cf A689ad11e6cd 08)
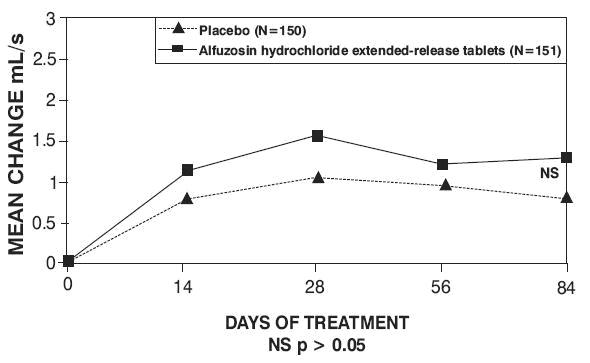
A line graph comparing mean change in mL/s over days of treatment between Placebo and Alfuzosin hydrochloride extended-release tablets (10 mg). The x-axis represents days of treatment from 0 to 84, and the y-axis shows mean change in mL/s from 0 to 3. Both groups show an initial increase, with Alfuzosin peaking around day 28 before declining, while Placebo remains lower. NS (not significant) is noted for p > 0.05.*
FDA Label Image

Company Logo (Ef35abcf E0b6 4551 84cf A689ad11e6cd 09)

FDA Label Image

Company Logo (Ef35abcf E0b6 4551 84cf A689ad11e6cd 10)

* About these descriptions: Image descriptions on this page are generated by automated AI analysis of the product label images from the manufacturer's FDA label submission (SPL). They are provided for reference only and may contain errors or omissions. Always rely on the printed label itself and the official FDA labeling, and consult a pharmacist or healthcare professional with any questions about this product.