Rocuronium Bromide Injection, Solution
Product Images NDC 51662-1640

View Photos of Packaging, Regulatory Labels, and Product Appearance

Product Visual Gallery

This gallery contains 15 technical images submitted to the FDA as part of the official labeling for Rocuronium Bromide (NDC 51662-1640). Unlike standard consumer photos, these assets often include clinical data figures, molecular chemical structures, and official manufacturer packaging layouts.

As provided by Hf Acquisition Co Llc, Dba Healthfirst, these visuals offer a comprehensive scientific overview of the product's physical and chemical identity, aiding pharmacists and researchers in product verification and study.

FDA Label Image

Vial Label (51662 1640 1 Vail Rfid Label)

Vial Label (51662 1640 1 Vail Rfid Label)
The image shows a text panel with lot numbers, product codes, and a note referencing the manufacturer's package insert for Rocuronium Bromide injection, solution. It includes distribution information by HF Acquisition Co., LLC, DBA HealthFirst, located in Mukilteo, Washington.*
FDA Label Image

Figures (Figure 3)

Figures (Figure 3)
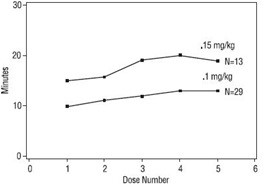
A line graph depicting the relationship between dose number (ranging from 0 to 6) and time in minutes (ranging from 0 to 30). It shows two plotted lines representing doses of .1 mg/kg and .15 mg/kg with corresponding sample sizes of 29 and 13, respectively.*
FDA Label Image

Figures (Figures 1 And 2 51662 1640 1)

Figures (Figures 1 And 2 51662 1640 1)
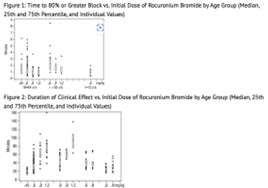
Two scatter plots showing clinical data related to Rocuronium Bromide injection. The first graph depicts Time to 80% or Greater Block versus Initial Dose by age group with median, 25th and 75th percentiles, and individual values. The second graph shows Duration of Clinical Effect versus Initial Dose by age group with similar statistical markers.*
FDA Label Image

How Supplied (How Supplied 51662 1640 1)

How Supplied (How Supplied 51662 1640 1)
A data table listing information for Rocuronium Bromide Injection (10 mg/mL). It includes the NDC number 51662-1640-1, packaging as a 50 mg/5 mL multiple dose vial, and a package factor of 10 vials per carton.*
FDA Label Image

Structure (Structure 51662 1640 1)

Structure (Structure 51662 1640 1)
Chemical structure diagram of rocuronium bromide, showing the arrangement of rings, functional groups, and bromide ion (Br-).*
FDA Label Image

Table 1 (Table 1 51662 1640 1)

Table 1 (Table 1 51662 1640 1)
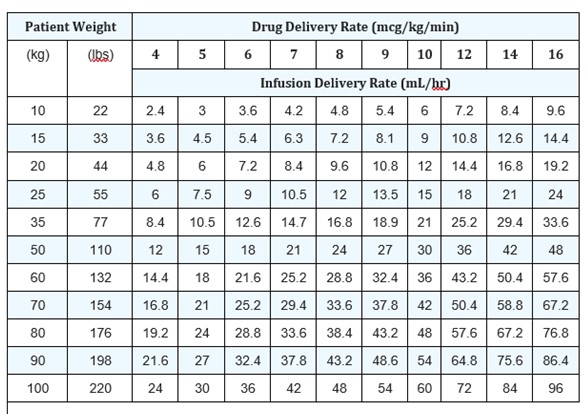
A data table showing infusion delivery rates (mL/hr) and corresponding drug delivery rates (mcg/kg/min) for varying patient weights in kg and lbs. The table provides detailed dosing information across multiple flow rates ranging from 4 to 16 mL/hr, assisting precise intravenous administration calculations.*
FDA Label Image

Table 2 (Table 2 51662 1640 1)

Table 2 (Table 2 51662 1640 1)
A dosing reference table correlating patient weight (in kilograms and pounds) with drug delivery rates for Rocuronium Bromide injection. It details infusion delivery rates in milliliters per hour corresponding to drug delivery rates in micrograms per kilogram per minute across weight categories from 10 to 100 kg.*
FDA Label Image

Table 3 (Table 3 51662 1640 1)

Table 3 (Table 3 51662 1640 1)
A data table showing infusion delivery rates in mL/hr for rocuronium bromide injection based on patient weight (kg and lbs) and drug delivery rate in mcg/kg/min. The table correlates different weights ranging from 20 kg to 100 kg to infusion rates over drug delivery rates from 4 to 16 mcg/kg/min.*
FDA Label Image

Table 4 (Table 4 51662 1640 1)

Table 4 (Table 4 51662 1640 1)
A data table presenting Rocuronium Bromide dose (mg/kg) administered over 5 seconds, percent of patients with one or good intubating conditions, and time to completion of intubation (minutes). The table includes data for adults, infants (3 months to 1 year), and pediatric patients (1 to 12 years), with dose ranges and corresponding intubation success rates and times.*
FDA Label Image

Table 5 (Table 5 51662 1640 1)

Table 5 (Table 5 51662 1640 1)
A data table showing Rocuronium Bromide dose (mg/kg) administered over 5 minutes and corresponding pharmacodynamic parameters: time to ≥80% block, time to maximum block, and clinical duration (minutes). The data are grouped by age categories: adults (18 to 64 years), geriatrics (65+ years), infants (3 months to 1 year), and pediatrics (1 to 12 years), with median values and ranges shown for each group.*
FDA Label Image

Table 6 (Table 6 51662 1640 1)

Table 6 (Table 6 51662 1640 1)
A data table showing pharmacokinetic parameters for Rocuronium Bromide injection solution at 10 mg/mL strength administered over 50 seconds. The table details time to maximum concentration and time to reappearance of muscle response across different age groups ranging from neonates to adults.*
FDA Label Image

Table 10 (Table 10 51662 1640 1)

Table 10 (Table 10 51662 1640 1)
A data table presenting pharmacokinetic parameters for rocuronium bromide across different patient age ranges, including clearance (CL), volume of distribution, and elimination half-life values. The table summarizes how these parameters vary by age group from birth to 17 years.*
FDA Label Image

Table 7 (Table 7 51662 1640 1)

Table 7 (Table 7 51662 1640 1)
Data table presenting pharmacokinetic parameters including clearance, volume of distribution at steady state, and half-life elimination for adults (age 27 to 58 years) and geriatrics (age 65 to 89 years). The values are shown with standard deviations in parentheses.*
FDA Label Image

Table 9 (Table 9 51662 1640 1)

Table 9 (Table 9 51662 1640 1)
A data table presenting pharmacokinetic parameters of Rocuronium Bromide according to patient age ranges. It includes clearance (L/kg/hr), volume of distribution at steady state (L/kg), and elimination half-life (hr) for ages 3 to <12 months, 1 to <3 years, and 3 to <8 years.*
FDA Label Image

Table 8 (Table 8 51662 1640 1)

Table 8 (Table 8 51662 1640 1)
A data table displaying pharmacokinetic parameters including clearance, volume of distribution at steady state, and half-life elimination for rocuronium bromide. The table compares values among normal renal and hepatic function, renal transplant patients, and hepatic dysfunction patients, with units and standard deviations noted.*

* About these descriptions: Image descriptions on this page are generated by automated AI analysis of the product label images from the manufacturer's FDA label submission (SPL). They are provided for reference only and may contain errors or omissions. Always rely on the printed label itself and the official FDA labeling, and consult a pharmacist or healthcare professional with any questions about this product.