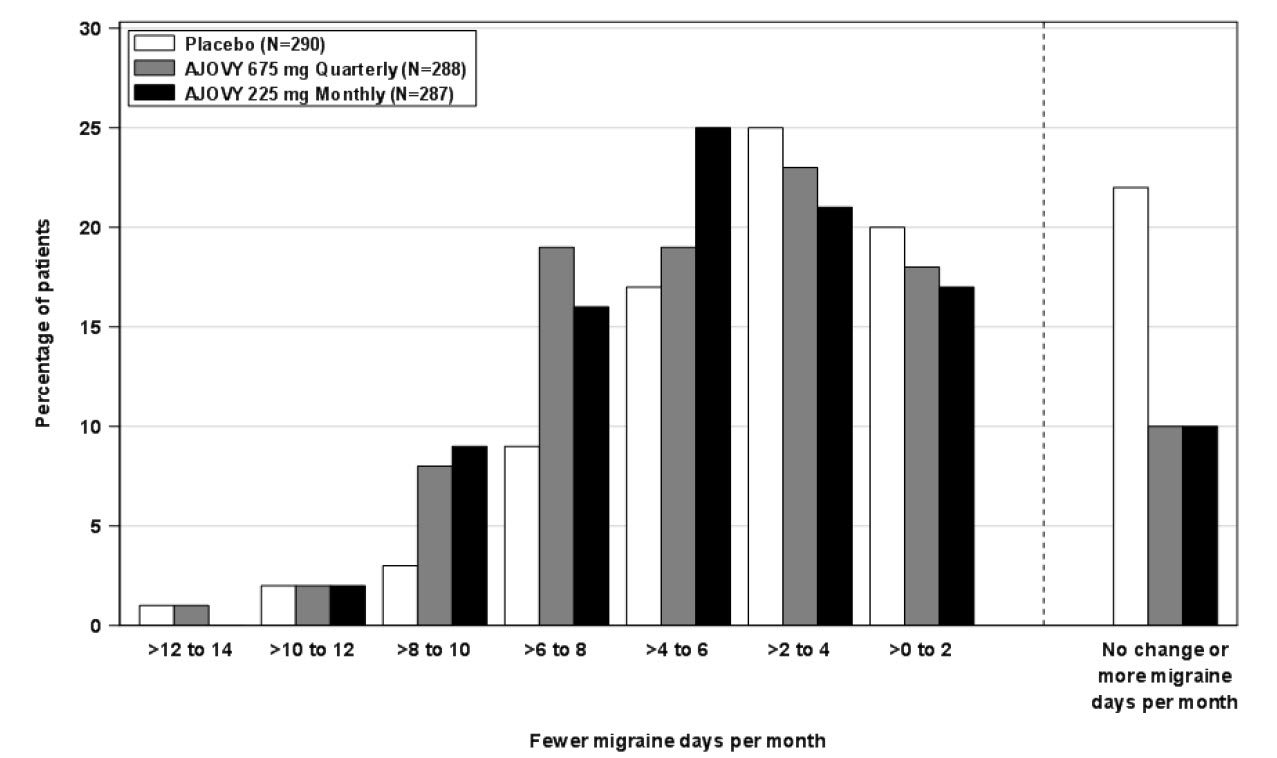
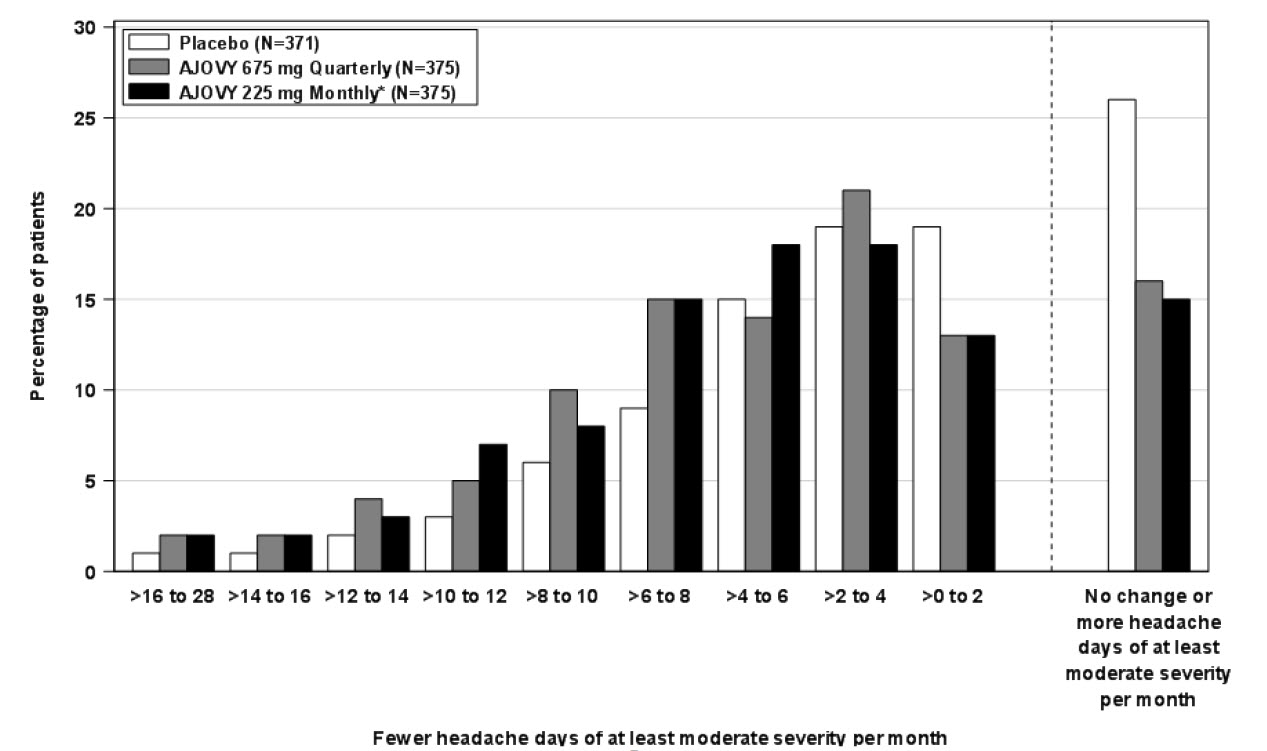
Ajovy Injection
Product Images NDC 51759-202

View Photos of Packaging, Regulatory Labels, and Product Appearance

Product Visual Gallery

This gallery contains 32 technical images submitted to the FDA as part of the official labeling for Ajovy (NDC 51759-202). Unlike standard consumer photos, these assets often include clinical data figures, molecular chemical structures, and official manufacturer packaging layouts.

As provided by Teva Pharmaceuticals Usa, Inc., these visuals offer a comprehensive scientific overview of the product's physical and chemical identity, aiding pharmacists and researchers in product verification and study.

FDA Label Image

Figure 1 (Image 1)

Figure 1 (Image 1)
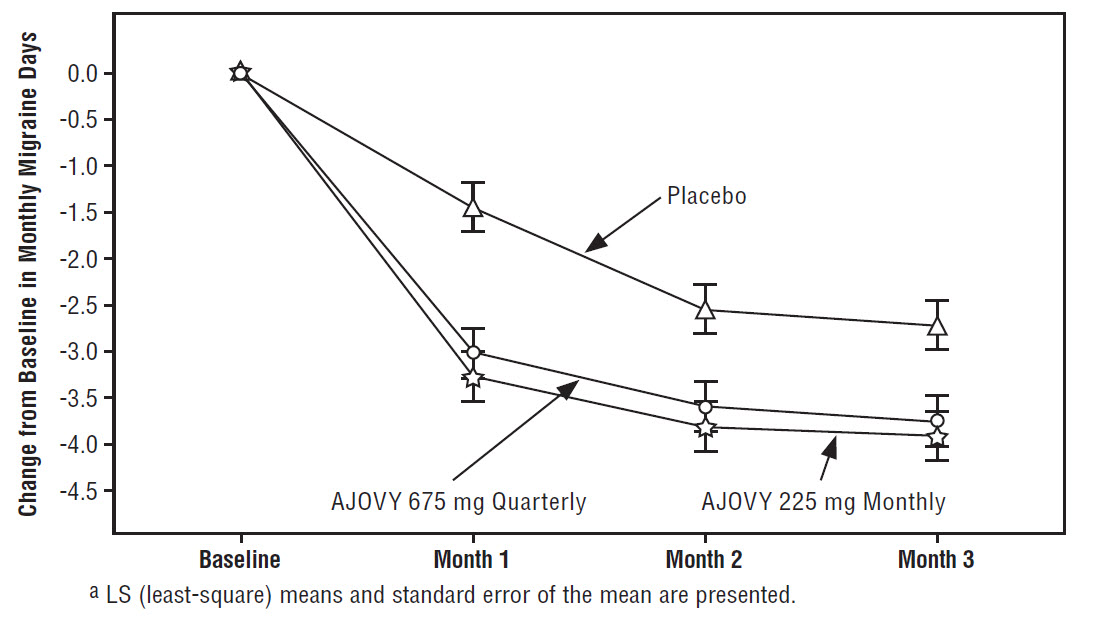
This is a graph showing the change in the number of monthly migraine days from baseline for four different treatments: placebo, AJOVY 675 mg quarterly, AJOVY 225 mg monthly, and an unspecified treatment denoted by "A & A." The graph displays the least-square means and standard error of the mean for baseline, month 1, month 2, and month 3.*
FDA Label Image

Clock Image (Image 10)

FDA Label Image

Figure E (Image 11)

FDA Label Image

Figure F (Image 12)

FDA Label Image

Figure G (Image 13)

FDA Label Image

Step 9 Image (Image 14)

FDA Label Image

Figure H (Image 15)

Figure H (Image 15)
The text is describing a set of instructions to hold something down for 10 seconds. It is unclear what specifically is being held down as no additional information is provided.*
FDA Label Image

Step 12 Image (Image 16)

FDA Label Image

Carton Part 1 (Image 17)

FDA Label Image

Carton Part 2 (Image 18)

Carton Part 2 (Image 18)
This appears to be a diagram or labeled image of a syringe with annotations for a needle cap, expiration date label, thumb pad, syringe body, and finger flange.*
FDA Label Image

Image 19

FDA Label Image

Figure 2 (Image 2)

Figure 2 (Image 2)
This is a graph showing the percentage of patients with varying levels of migraine days per month for three different treatments: placebo, AJOVY 675 mg quarterly, and AJOVY 225 mg monthly. The x-axis shows the range of migraine days per month from 0 to over 12. The y-axis shows the percentage of patients in each treatment group falling within the different migraine day ranges. The graph indicates that AJOVY 675 mg quarterly and AJOVY 225 mg monthly have a higher percentage of patients with fewer migraine days per month compared to the placebo group.*
FDA Label Image

Image 20

FDA Label Image

Image 21

FDA Label Image

Image 22

Image 22
This appears to be a list of medical supplies which includes gauze pads or cotton balls, a sharps container, alcohol swab, and a pre-filled syringe for a medication called AJOVY.*
FDA Label Image

Image 23

FDA Label Image

Image 24

FDA Label Image

Image 25

FDA Label Image

Image 26

Image 26
Do not put the needle cap back on the prefilled syringe.*
FDA Label Image

Image 27

FDA Label Image

Image 28

FDA Label Image

Image 29

FDA Label Image

Figure 3 (Image 3)

Figure 3 (Image 3)
The text describes the change of monthly headache days of at least moderate severity for patients taking AJOVY 675mg quarterly or AJOVY 225mg monthly, presented in baseline and months 1-3. LS means and standard errors are included in the data. This information is useful for evaluating the effectiveness of these medications in reducing headache days.*
FDA Label Image

Image 30

Image 30
This appears to be a product label for AJOVY (remanezumab), which is likely a medication administered via injection.*
FDA Label Image

Image 31

FDA Label Image

Image 32

FDA Label Image

Figure 4 (Image 4)

Figure 4 (Image 4)
This text seems to be a graph indicating the percentage of patients and the number of headache days of at least moderate severity per month for a placebo group and two different doses of a medication called AJOVY. The x-axis indicates the number of headache days while the y-axis indicates the percentage of patients. The AJOVY treatment groups (675 mg Quarterly and 225 mg Monthly) have lower percentages of patients experiencing more headache days compared to the placebo group. There is also a key indicating the dosage groups and a legend indicating the change in headache days.*
FDA Label Image

Figure A (Image 5)

FDA Label Image

Figure B (Image 6)

FDA Label Image

Stop Image (Image 7)

FDA Label Image

Figure C (Image 8)

FDA Label Image

Figure D (Image 9)

* These product label images have been analyzed using experimental machine learning. Please verify findings with the primary label text.