Image (Darifenacin Fig01)
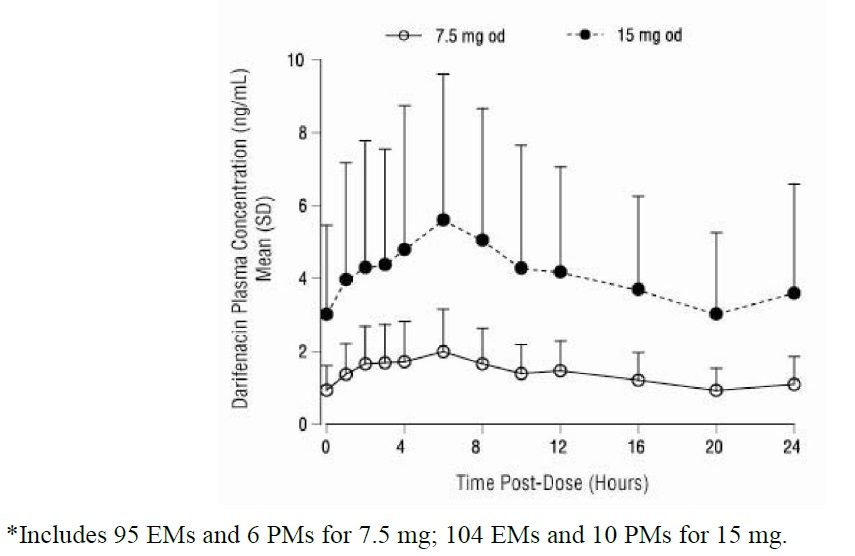
This appears to be a graph showing the percentage of patients with certain genotypes (EMs and PMs) who were administered doses of either 7.5mg or 15mg. The graph shows the percentage of patients who achieved a certain level of drug concentration over a certain amount of time after the dose. The time is measured in hours and ranges from 0 to 24 hours. The medication name, patient condition, or purpose of the graph is not available.*