Flector
Product Images NDC 52959-518

6 FDA label images from H.j. Harkins Company, Inc. · Packaging, Regulatory Labels, and Product Appearance

Product Visual Gallery

This gallery contains 6 technical images submitted to the FDA as part of the official labeling for Flector (NDC 52959-518). Unlike standard consumer photos, these assets often include clinical data figures, molecular chemical structures, and official manufacturer packaging layouts.

As provided by H.j. Harkins Company, Inc., these visuals offer a comprehensive scientific overview of the product's physical and chemical identity, aiding pharmacists and researchers in product verification and study.

FDA Label Image

Chemical Structure (Flector 01)
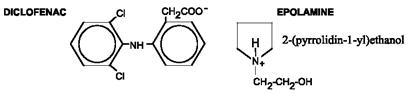
Chemical Structure (Flector 01)
Chemical structures of diclofenac and epolamine are shown side by side. Diclofenac's structure includes a chlorinated phenyl ring and a carboxyl group, while epolamine is depicted as 2-(pyrrolidin-1-yl)ethanol.*
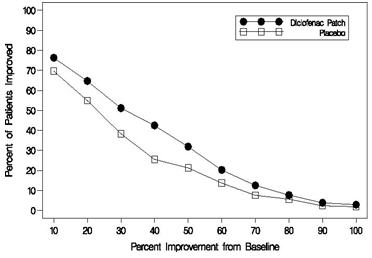
FDA Label Image

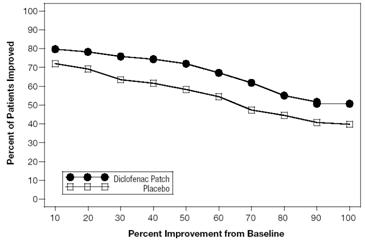
Figure 1 (Flector 02)

Figure 1 (Flector 02)
A line graph comparing percent improvement from baseline against the percent of patients improved for two groups: those using Diclofenac Patch and those using a placebo. The graph shows a higher percentage of patients improved with Diclofenac Patch compared to placebo across different levels of improvement.*
FDA Label Image

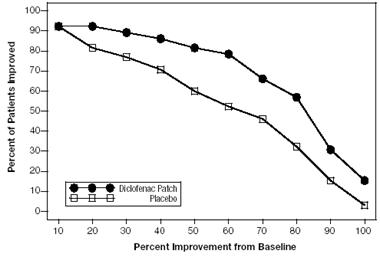
Figure 2 (Flector 03)

Figure 2 (Flector 03)
A line graph comparing percent improvement from baseline on the x-axis with the percent of patients improved on the y-axis. It shows two data series: diclofenac patch and placebo, indicating higher patient improvement percentages for the diclofenac patch at most points along the baseline improvement scale.*
FDA Label Image

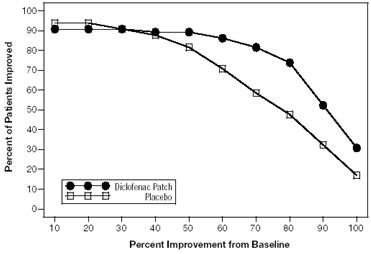
Figure 3 (Flector 04)

Figure 3 (Flector 04)
A line graph comparing the percent of patients improved over time from baseline for Diclofenac Patch versus placebo. The x-axis represents percent improvement from baseline, while the y-axis shows percent of patients improved. Two lines illustrate higher efficacy for Diclofenac Patch compared to placebo across the range.*
FDA Label Image

Figure 4 (Flector 05)

Figure 4 (Flector 05)
A line graph comparing the percent of patients improved versus percent improvement from baseline between two groups: patients using the Diclofenac Patch and a placebo group. The graph shows the Diclofenac Patch group maintaining higher percentages of patient improvement across a range of improvement bins compared to placebo.*
FDA Label Image

Principal Display Panel (1.3% Carton)

Principal Display Panel (1.3% Carton)
Flector 1.3% patch packaging label showing product name, concentration, lot number FCP00KP, manufacturer Kings Phar, expiration date 01/13, and a comparison to the Bristol manufacturer's NDC 60793-411-30. The label includes dosage instructions advising to follow the doctor or outsert for dosage, a caution about prescription-only status and storage instructions, and multiple smaller labels with NDC, lot, and quantity details (30 patches). The labeler is H.J. Harkins Company, Inc.*

* About these descriptions: Image descriptions on this page are generated by automated AI analysis of the product label images from the manufacturer's FDA label submission (SPL). They are provided for reference only and may contain errors or omissions. Always rely on the printed label itself and the official FDA labeling, and consult a pharmacist or healthcare professional with any questions about this product.