Topiramate-fig01 (Topiramate Fig01)
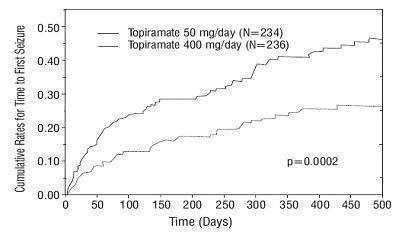
This appears to be a chart or graph showing the rates of a certain variable over time (measured in days). The y-axis is labeled with values ranging from 0 to 50, and the x-axis is labeled with intervals of 50 days up to a maximum value of 500. The title or subject of this chart is not clear, but there appears to be a statistically significant data point marked with "p=0.0002."*