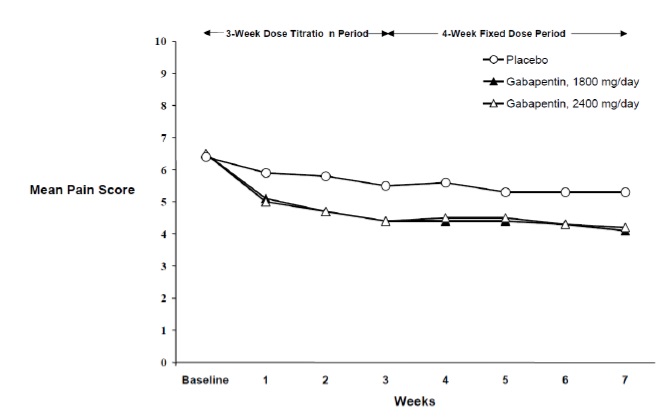
Product Images Gabapentin

View Photos of Packaging, Labels & Appearance

Product Label Images

The following 7 images provide visual information about the product associated with Gabapentin NDC 53002-1538 by Rpk Pharmaceuticals, Inc., such as packaging, labeling, and the appearance of the drug itself. This resource could be helpful for medical professionals, pharmacists, and patients seeking to verify medication information and ensure they have the correct product.

Figure 1 - image 01

Figure 1 - image 01

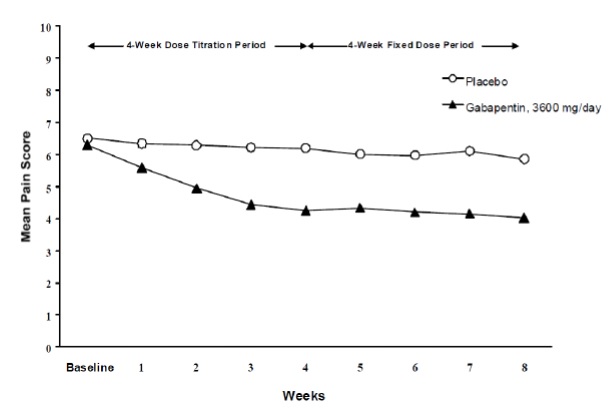
This is a table that shows the mean pain score for two different treatments, Parkod and Gabapentin, over the course of several weeks. The pain score for the placebo treatment is also shown. The table has two periods: a four-week dose titration period and a six-week fixed dose period. The data for the baseline and weeks is available.*

Figure 2 - image 02

Figure 2 - image 02

This appears to be a chart or graph displaying the mean pain score for individuals who received a placebo or varying doses of Gabapentin during a 4-week fixed dose period. The x-axis represents the weeks of the study, while the y-axis represents the pain score. The doses of Gabapentin administered were 1800 mg/day and 2400 mg/day. The graph shows a decrease in mean pain score over the course of the study for all groups, with the 2400 mg/day group generally experiencing the lowest pain scores.*

Figure 3 - image 03

Figure 3 - image 03

image-04 - image 04

image-04 - image 04

Gabapentin Structural Formula - image 05

Gabapentin Structural Formula - image 05

image-09 - image 09

image-09 - image 09

Label Image - lbl530021538

Label Image - lbl530021538

* The product label images have been analyzed using a combination of traditional computing and machine learning techniques. It should be noted that the descriptions provided may not be entirely accurate as they are experimental in nature. Use the information in this page at your own discretion and risk.