Duloxetine Fig1
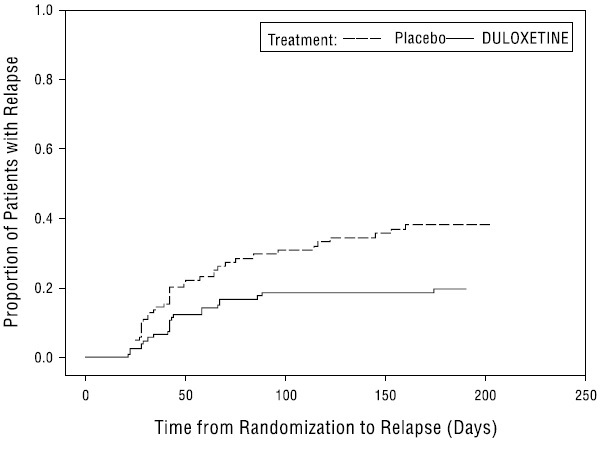
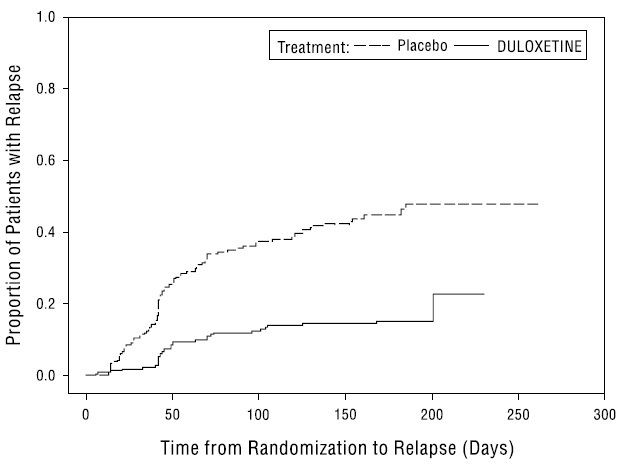
This data appears to be a graph showing the time from randomization to relapse for patients with relapse who were treated with placebo versus Duloxetine. The x-axis measures time in days, ranging from 0 to approximately 250, and the y-axis measures the number of patients with relapse, ranging from 0.4 to 1.0. It is not possible to determine the context or significance of this information without additional information.*