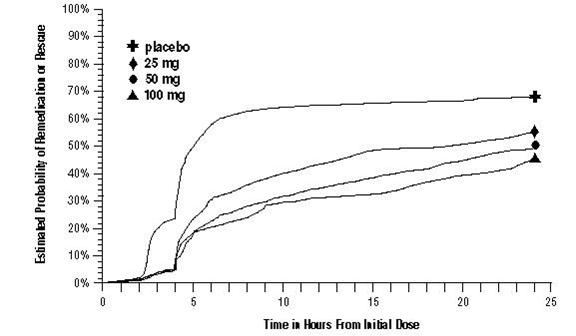
Figure1 (Figure1)
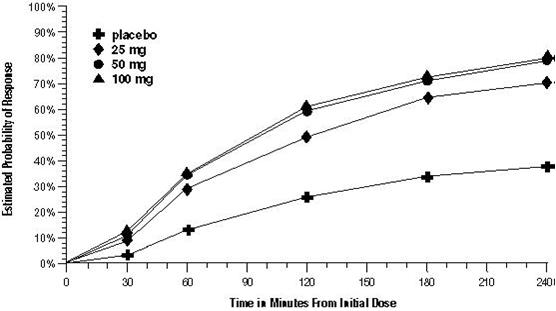
This text seems to be a chart or a table showing the estimated probability of a response. The chart consists of three values, namely 100%, 70%, and 0%, which seem to indicate the likelihood of a certain response. However, it is not clear what type of response or situation the chart is referring to without additional information.*