Valsartan And Hydrochlorothiazide
Product Images NDC 53002-2785

View Photos of Packaging, Regulatory Labels, and Product Appearance

Product Visual Gallery

This gallery contains 7 technical images submitted to the FDA as part of the official labeling for Valsartan And Hydrochlorothiazide (NDC 53002-2785). Unlike standard consumer photos, these assets often include clinical data figures, molecular chemical structures, and official manufacturer packaging layouts.

As provided by Rpk Pharmaceuticals, Inc., these visuals offer a comprehensive scientific overview of the product's physical and chemical identity, aiding pharmacists and researchers in product verification and study.

FDA Label Image

Label Image (Lbl530022785)
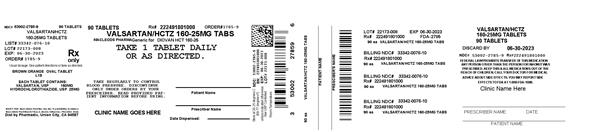
Label Image (Lbl530022785)
Packaging label for Valsartan and Hydrochlorothiazide 160-25mg tablets by RPK Pharmaceuticals, Inc. The label shows packaging details for 90 tablets with instructions to take one tablet daily, includes barcodes, lot number, expiration date, and spaces for clinic and patient information.*
FDA Label Image

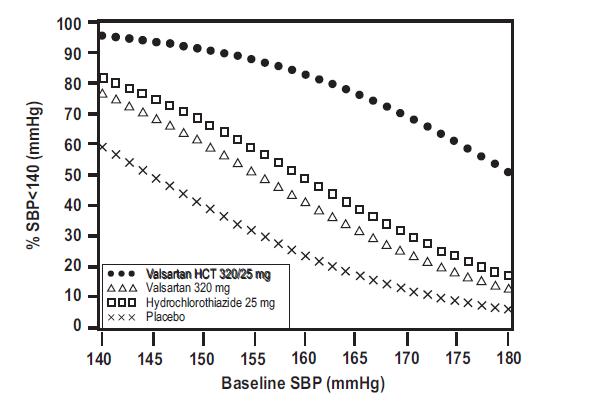
Figure-1 (Valsartan Hctz Figure 1)

Figure-1 (Valsartan Hctz Figure 1)
A line graph depicting the percentage of subjects with systolic blood pressure (SBP) below 140 mmHg on the vertical axis versus baseline SBP (mmHg) on the horizontal axis. The graph compares Valsartan and Hydrochlorothiazide combination 320/25 mg, Valsartan 320 mg, Hydrochlorothiazide 25 mg, and placebo groups, illustrating differences in blood pressure control across baseline SBP values.*
FDA Label Image

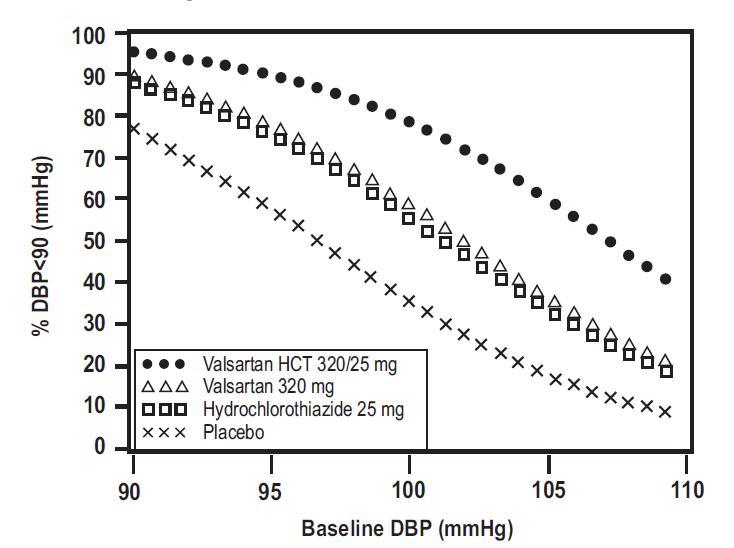
Figure-2 (Valsartan Hctz Figure 2)

Figure-2 (Valsartan Hctz Figure 2)
A line graph showing the relationship between Baseline Diastolic Blood Pressure (DBP) in mmHg on the x-axis and the percentage of DBP less than 90 mmHg (% DBP<90) on the y-axis. The graph compares four groups: Valsartan HCT 320/25 mg, Valsartan 320 mg, Hydrochlorothiazide 25 mg, and placebo, each represented by distinct markers and lines. The Valsartan HCT 320/25 mg group shows the highest percentage of DBP<90 at baseline DBP ranging from 90 to 110 mmHg.*
FDA Label Image

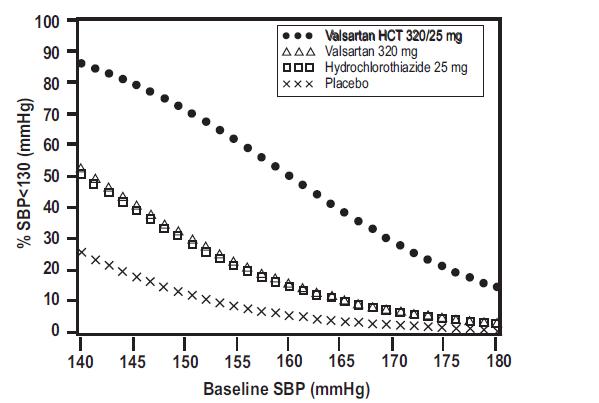
Figure-3 (Valsartan Hctz Figure 3)

Figure-3 (Valsartan Hctz Figure 3)
A line graph showing the percentage of subjects achieving systolic blood pressure (SBP) under 130 mmHg across different baseline SBP levels. The chart compares Valsartan HCT 320/25 mg, Valsartan 320 mg, Hydrochlorothiazide 25 mg, and placebo, with symbols representing each treatment group as indicated in the legend.*
FDA Label Image

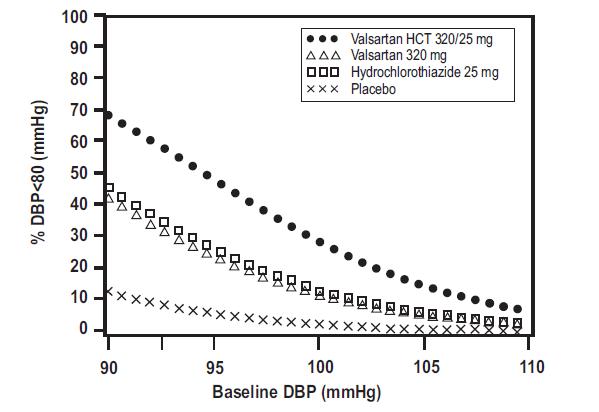
Figure-4 (Valsartan Hctz Figure 4)

Figure-4 (Valsartan Hctz Figure 4)
A line graph illustrating the percentage of diastolic blood pressure (DBP) below 80 mmHg versus baseline DBP (mmHg). It compares four groups: Valsartan HCT 320/25 mg, Valsartan 320 mg, Hydrochlorothiazide 25 mg, and Placebo, using distinct markers for each.*
FDA Label Image

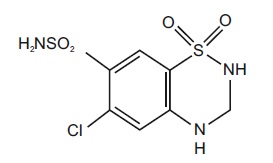
Hctz-stru (Valsartan Hctz Hydrochlorothiazide)

Hctz-stru (Valsartan Hctz Hydrochlorothiazide)
Chemical structure of the active ingredient valsartan and hydrochlorothiazide, showing a benzene ring with attached chlorine, sulfonamide, and amino functional groups.*
FDA Label Image

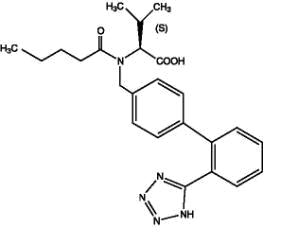
Valsartan-str (Valsartan Hctz Valsartan)

Valsartan-str (Valsartan Hctz Valsartan)
Chemical structure of Valsartan, an active ingredient in the pharmaceutical product Valsartan and Hydrochlorothiazide by RPK Pharmaceuticals, Inc. The structure depicts the molecular arrangement of atoms and bonds characteristic of Valsartan.*

* About these descriptions: Image descriptions on this page are generated by automated AI analysis of the product label images from the manufacturer's FDA label submission (SPL). They are provided for reference only and may contain errors or omissions. Always rely on the printed label itself and the official FDA labeling, and consult a pharmacist or healthcare professional with any questions about this product.