Valsartan And Hydrochlorothiazide
Product Images NDC 53002-2786

View Photos of Packaging, Regulatory Labels, and Product Appearance

Product Visual Gallery

This gallery contains 7 technical images submitted to the FDA as part of the official labeling for Valsartan And Hydrochlorothiazide (NDC 53002-2786). Unlike standard consumer photos, these assets often include clinical data figures, molecular chemical structures, and official manufacturer packaging layouts.

As provided by Rpk Pharmaceuticals, Inc., these visuals offer a comprehensive scientific overview of the product's physical and chemical identity, aiding pharmacists and researchers in product verification and study.

FDA Label Image

Label Image (Lbl530022786)

Label Image (Lbl530022786)
Packaging label for Valsartan and Hydrochlorothiazide 160-12.5mg tablets. The label indicates a supply of 90 tablets, with instructions to take 1 tablet daily as directed. The labeler is RPK Pharmaceuticals, Inc. The label includes space for patient and prescriber information, along with NDC codes and other regulatory details.*
FDA Label Image

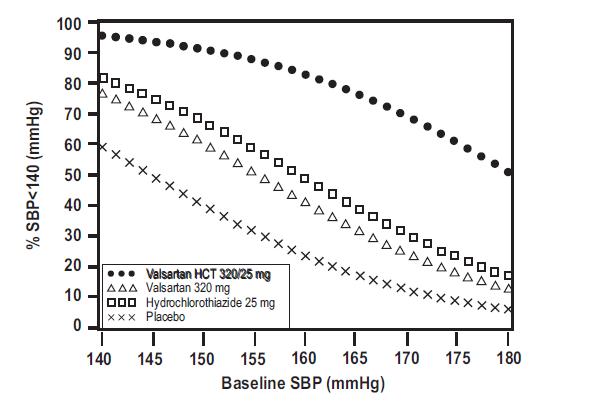
Figure-1 (Valsartan Hctz Figure 1)

Figure-1 (Valsartan Hctz Figure 1)
A line chart illustrating the percentage of patients with systolic blood pressure (SBP) under 140 mmHg plotted against baseline SBP (140 to 180 mmHg). The graph compares four groups: Valsartan and Hydrochlorothiazide 320/25 mg, Valsartan 320 mg, Hydrochlorothiazide 25 mg, and placebo, each represented by different symbols. The chart shows decreasing percentages as baseline SBP increases for all groups.*
FDA Label Image

Figure-2 (Valsartan Hctz Figure 2)

Figure-2 (Valsartan Hctz Figure 2)
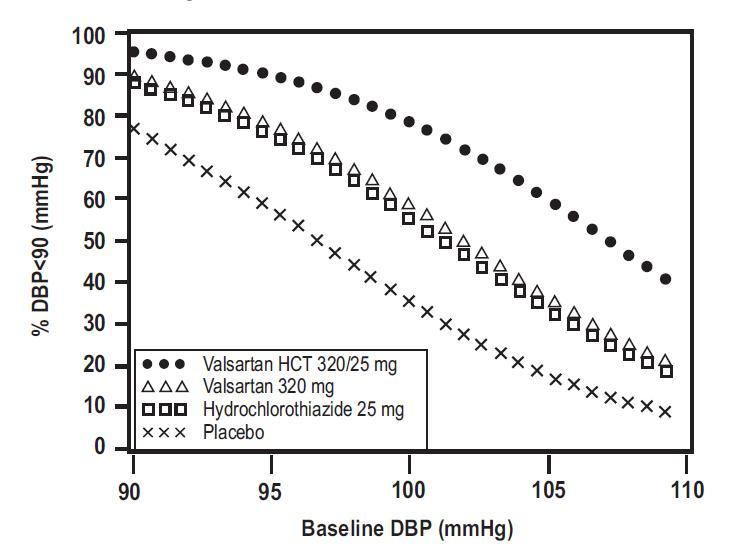
A line graph showing the percent of patients with diastolic blood pressure below 90 mmHg (% DBP<90) plotted against baseline diastolic blood pressure (DBP) in mmHg. The graph compares the effects of Valsartan HCT 320/25 mg, Valsartan 320 mg, Hydrochlorothiazide 25 mg, and Placebo, with distinct markers for each treatment group.*
FDA Label Image

Figure-3 (Valsartan Hctz Figure 3)

Figure-3 (Valsartan Hctz Figure 3)
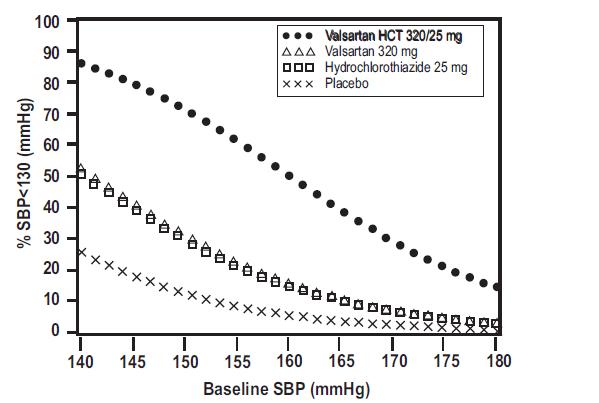
A line graph comparing the percentage of patients with systolic blood pressure (SBP) below 130 mmHg against baseline SBP (140 to 180 mmHg) for four groups: Valsartan HCT 320/25 mg, Valsartan 320 mg, Hydrochlorothiazide 25 mg, and Placebo. The Valsartan HCT group shows the highest percentage achieving SBP <130 mmHg across baseline SBP values, followed by Valsartan, Hydrochlorothiazide, and Placebo.*
FDA Label Image

Figure-4 (Valsartan Hctz Figure 4)

Figure-4 (Valsartan Hctz Figure 4)
A line graph showing the percentage of patients with diastolic blood pressure (DBP) below 80 mmHg plotted against baseline DBP ranging from 90 to 110 mmHg. The graph compares four groups: Valsartan HCT 320/25 mg, Valsartan 320 mg, Hydrochlorothiazide 25 mg, and Placebo, with each group represented by distinct markers as indicated in the legend.*
FDA Label Image

Hctz-stru (Valsartan Hctz Hydrochlorothiazide)

Hctz-stru (Valsartan Hctz Hydrochlorothiazide)
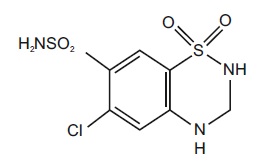
Chemical structure diagram of the active ingredient in Valsartan and Hydrochlorothiazide by RPK Pharmaceuticals, Inc. The diagram shows the molecular arrangement including rings, bonds, and functional groups such as sulfonamide and chloride substitutions.*
FDA Label Image

Valsartan-str (Valsartan Hctz Valsartan)

Valsartan-str (Valsartan Hctz Valsartan)
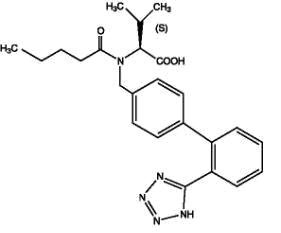
Chemical structure of valsartan, illustrating the molecular configuration with its characteristic functional groups and rings as typically depicted in pharmaceutical labels for the Valsartan and Hydrochlorothiazide combination product.*

* About these descriptions: Image descriptions on this page are generated by automated AI analysis of the product label images from the manufacturer's FDA label submission (SPL). They are provided for reference only and may contain errors or omissions. Always rely on the printed label itself and the official FDA labeling, and consult a pharmacist or healthcare professional with any questions about this product.