Sumatriptan
Product Images NDC 53002-3562

4 FDA label images from Rpk Pharmaceuticals, Inc. · Packaging, Regulatory Labels, and Product Appearance

Product Visual Gallery

This gallery contains 4 technical images submitted to the FDA as part of the official labeling for Sumatriptan (NDC 53002-3562). Unlike standard consumer photos, these assets often include clinical data figures, molecular chemical structures, and official manufacturer packaging layouts.

As provided by Rpk Pharmaceuticals, Inc., these visuals offer a comprehensive scientific overview of the product's physical and chemical identity, aiding pharmacists and researchers in product verification and study.

FDA Label Image

Label Image (Lbl530023562)

Label Image (Lbl530023562)
Sumatriptan 100 mg tablets packaging label from RPK Pharmaceuticals, Inc. The label includes directions to take as directed or to take off the package, patient and clinic information fields, prescription details, barcode, and NDC codes. The label is designed for a 1 pack of 9 tablets and includes spaces for dispensing pharmacy information, dates, and prescriber details.*
FDA Label Image

Chemical Structure (Sumatriptan Figure 1)

Chemical Structure (Sumatriptan Figure 1)
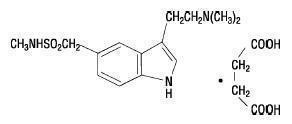
Chemical structure diagram of Sumatriptan, showing its molecular configuration including sulfonamide, indole, and carboxylic acid groups along with a side chain and associated molecular fragments.*
FDA Label Image

Figure 1 (Sumatriptan Figure 2)

Figure 1 (Sumatriptan Figure 2)
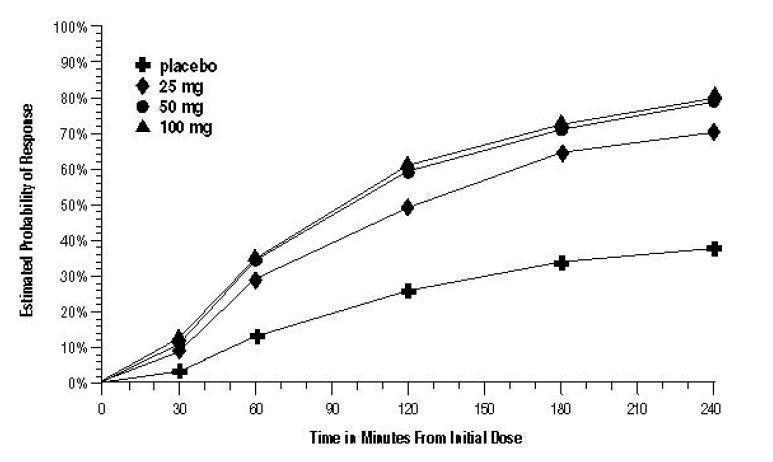
A line graph showing the estimated probability of response over time in minutes from initial dose for Sumatriptan at doses of 25 mg, 50 mg, 100 mg, and placebo. The graph indicates response rates increasing over 240 minutes, with 50 mg and 100 mg doses showing higher response probabilities compared to 25 mg and placebo.*
FDA Label Image

Figure 2 (Sumatriptan Figure 3)

Figure 2 (Sumatriptan Figure 3)
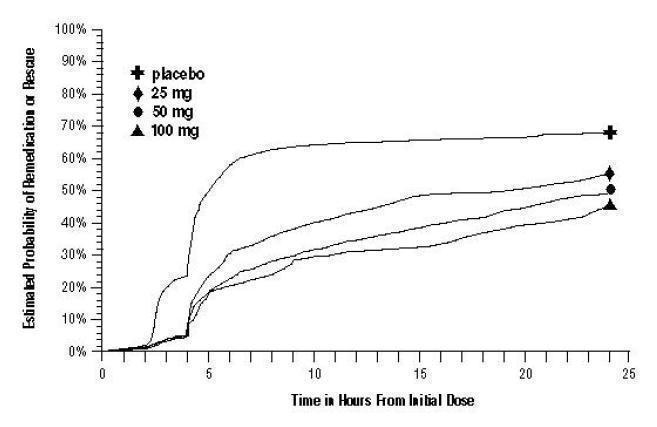
A line graph depicting the estimated probability of remission or rescue over 24 hours from the initial dose for Sumatriptan at doses of 25 mg, 50 mg, 100 mg, and placebo. The x-axis shows time in hours, and the y-axis represents the estimated probability in percentage. Four distinct curves correspond to placebo, 25 mg, 50 mg, and 100 mg dosages.*

* About these descriptions: Image descriptions on this page are generated by automated AI analysis of the product label images from the manufacturer's FDA label submission (SPL). They are provided for reference only and may contain errors or omissions. Always rely on the printed label itself and the official FDA labeling, and consult a pharmacist or healthcare professional with any questions about this product.