Losartan Potassium
Product Images NDC 53002-6624

View Photos of Packaging, Regulatory Labels, and Product Appearance

Product Visual Gallery

This gallery contains 6 technical images submitted to the FDA as part of the official labeling for Losartan Potassium (NDC 53002-6624). Unlike standard consumer photos, these assets often include clinical data figures, molecular chemical structures, and official manufacturer packaging layouts.

As provided by Rpk Pharmaceuticals, Inc., these visuals offer a comprehensive scientific overview of the product's physical and chemical identity, aiding pharmacists and researchers in product verification and study.

FDA Label Image

Label Image (Lbl530026624)
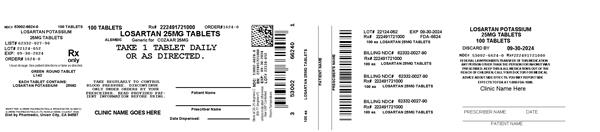
Label Image (Lbl530026624)
Losartan Potassium 25 mg tablets packaging label from RPK Pharmaceuticals, Inc. The label indicates a bottle containing 100 tablets with instructions to take 1 tablet daily as directed. It includes fields for patient name, date dispensed, and prescribing information, along with various barcodes, NDC numbers, and billing codes. The label confirms the product strength and quantity.*
FDA Label Image

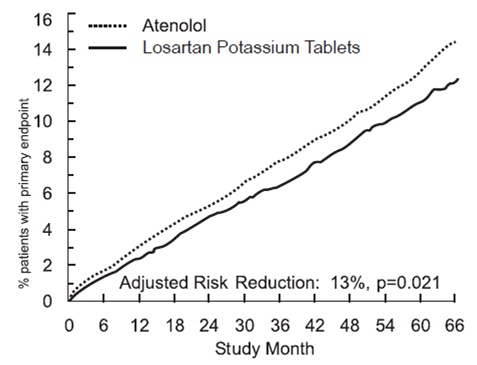
Figure 1 (Losartan Fig1)

Figure 1 (Losartan Fig1)
A line graph comparing the percentage of patients with a primary endpoint over study months for two treatments: Losartan Potassium Tablets (solid line) and Atenolol (dotted line). The x-axis represents study months from 0 to 66, and the y-axis shows the percentage of patients from 0 to 16%. The graph indicates an adjusted risk reduction of 13% with a p-value of 0.021 favoring Losartan Potassium Tablets.*
FDA Label Image

Figure 2 (Losartan Fig2)

Figure 2 (Losartan Fig2)
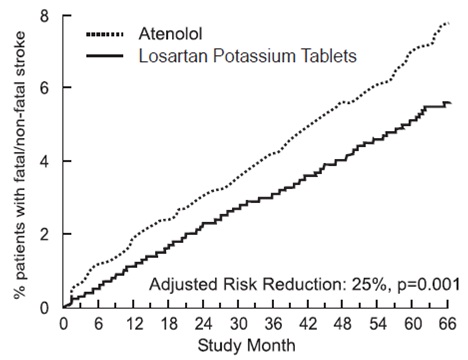
A line graph comparing the percentage of patients with fatal or non-fatal stroke over a 66-month study period for Atenolol and Losartan Potassium Tablets. The graph shows a lower percentage increase for Losartan Potassium Tablets compared to Atenolol, with an annotation indicating an adjusted risk reduction of 25% (p=0.001).*
FDA Label Image

Figure 3 (Losartan Fig3)

Figure 3 (Losartan Fig3)
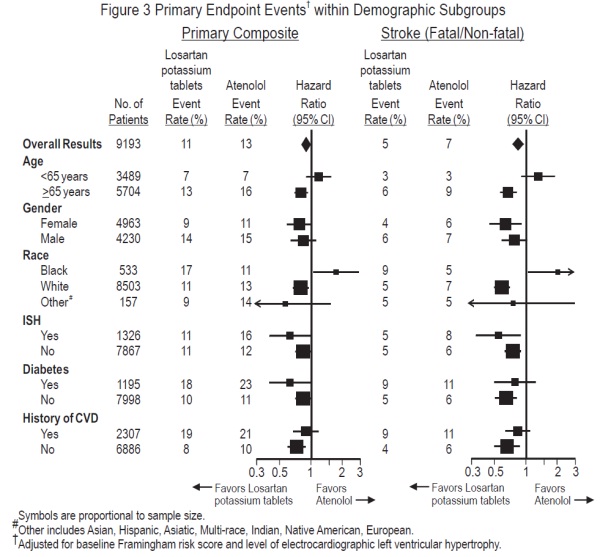
A forest plot chart showing primary endpoint events within demographic subgroups comparing Losartan potassium tablets and Atenolol. The chart presents event rates (%) and hazard ratios with 95% confidence intervals for primary composite and stroke (fatal/non-fatal) outcomes across subgroups based on age, gender, race, ischemic heart status, diabetes, and history of cardiovascular disease. The hazard ratio scale indicates whether results favor Losartan potassium tablets or Atenolol.*
FDA Label Image

Figure 4 (Losartan Fig4)

Figure 4 (Losartan Fig4)
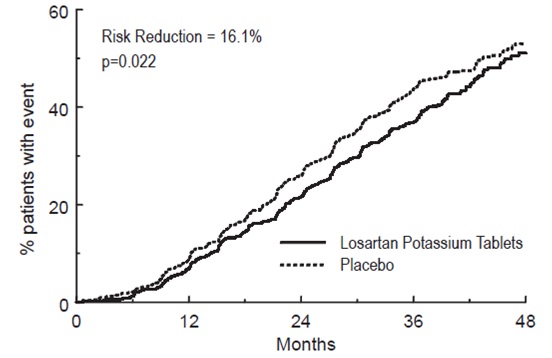
A line graph comparing the percentage of patients with events over 48 months between Losartan Potassium Tablets and placebo. The solid line represents Losartan Potassium, and the dotted line represents placebo. The graph indicates a risk reduction of 16.1% with a p-value of 0.022.*
FDA Label Image

Losartan-str.jpg (Losartan Str)

Losartan-str.jpg (Losartan Str)
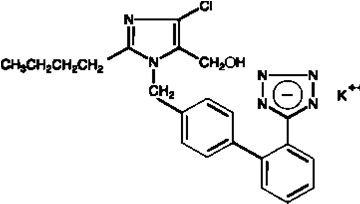
Chemical structure of losartan potassium illustrating the molecular arrangement and bonding of atoms, including characteristic groups such as a tetrazole ring and a biphenyl structure, with potassium ion (K+) shown.*

* About these descriptions: Image descriptions on this page are generated by automated AI analysis of the product label images from the manufacturer's FDA label submission (SPL). They are provided for reference only and may contain errors or omissions. Always rely on the printed label itself and the official FDA labeling, and consult a pharmacist or healthcare professional with any questions about this product.