Dutasteride
Product Images NDC 53345-037

View Photos of Packaging, Regulatory Labels, and Product Appearance

Product Visual Gallery

This gallery contains 9 technical images submitted to the FDA as part of the official labeling for Dutasteride (NDC 53345-037). Unlike standard consumer photos, these assets often include clinical data figures, molecular chemical structures, and official manufacturer packaging layouts.

As provided by Humanwell Puracap Pharmaceutical (wuhan), Ltd., these visuals offer a comprehensive scientific overview of the product's physical and chemical identity, aiding pharmacists and researchers in product verification and study.

FDA Label Image

Bulk Label (Bulk Duta)

Bulk Label (Bulk Duta)
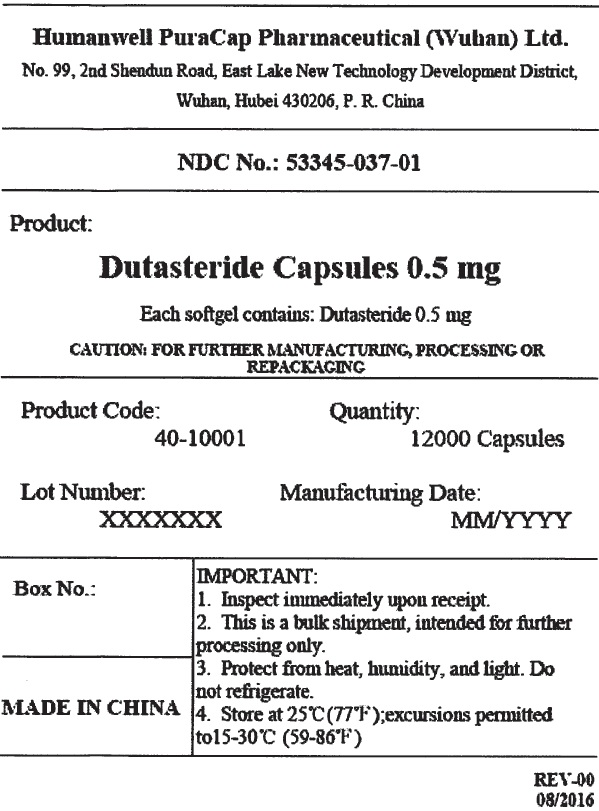
This is a product description for Dutasteride Capsules 0.5 mg from Humanwell PuraCap Pharmaceutical in Wuhan, China. The capsules come in a bulk shipment of 12,000 capsules, with each softgel containing 0.5 mg of Dutasteride. The product should be inspected upon receipt and protected from heat, humidity, and light. The capsules are intended for further manufacturing, processing, or repackaging. The lot number and manufacturing date are provided, and the product should be stored at 25°C (77°F), with excursions permitted to 15-30°C (59-86°F).*
FDA Label Image

Figure-1 (Figure 1)

FDA Label Image

Figure-2 (Figure 2)

Figure-2 (Figure 2)
This appears to be a graph that shows the number of events and the number of patients at risk for a treatment over a period of 24 months. The data is presented in two groups, Placetio Grulp and Dutasteride. The X-axis represents the number of months of treatment, while the Y-axis represents the number of events or numbers at risk. The percentage of patients is not available in this graph.*
FDA Label Image

Figure-3 (Figure 3)

FDA Label Image

Figure-4 (Figure 4)

FDA Label Image

Figure-5 (Figure 5)

Figure-5 (Figure 5)
The text represents a graph or chart showing the mean change from baseline in mL/sec after treatment with either a placebo or dutasteride over a period of 24 months. The graph has four lines representing the two treatments, each with a sample size indicated by "n" for different time intervals.*
FDA Label Image

Figure-6 (Figure 6)

FDA Label Image

Figure-7 (Figure 7)

FDA Label Image

Structural-formula (Image 01)

* These product label images have been analyzed using experimental machine learning. Please verify findings with the primary label text.