Terazosin Capsule
Product Images NDC 53401-022

View Photos of Packaging, Regulatory Labels, and Product Appearance

Product Visual Gallery

This gallery contains 14 technical images submitted to the FDA as part of the official labeling for Terazosin (NDC 53401-022). Unlike standard consumer photos, these assets often include clinical data figures, molecular chemical structures, and official manufacturer packaging layouts.

As provided by Aphena Pharma Solutions - Tennessee, Llc, these visuals offer a comprehensive scientific overview of the product's physical and chemical identity, aiding pharmacists and researchers in product verification and study.

FDA Label Image

Label (53401 0022 53)
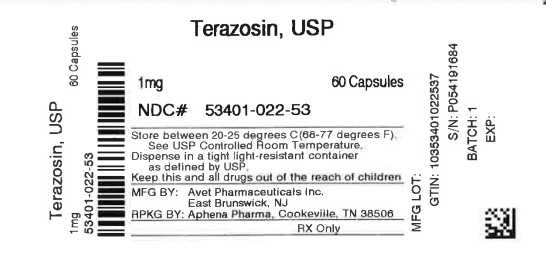
Label (53401 0022 53)
Label for Terazosin USP capsules with 1 mg strength, containing 60 capsules per bottle. The label includes storage instructions between 20-25 degrees Celsius, a National Drug Code (NDC) of 53401-022-53, and states the capsules are manufactured by Avet Pharmaceuticals Inc. in East Brunswick, NJ and repackaged by Aphena Pharma Solutions - Tennessee, LLC in Cookeville, TN. The label also indicates the product is prescription only.*
FDA Label Image

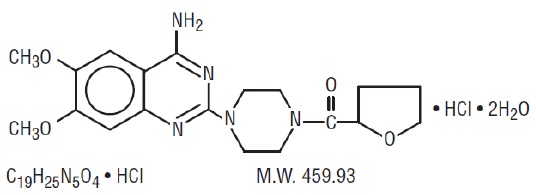
Image (98351704 9ff8 4c54 A2c2 E2841873d658 01)

Image (98351704 9ff8 4c54 A2c2 E2841873d658 01)
Chemical structure of terazosin hydrochloride dihydrate, showing its molecular framework including aromatic rings, amine groups, and ether linkages, with a molecular weight of 459.93.*
FDA Label Image

Image (98351704 9ff8 4c54 A2c2 E2841873d658 02)

Image (98351704 9ff8 4c54 A2c2 E2841873d658 02)
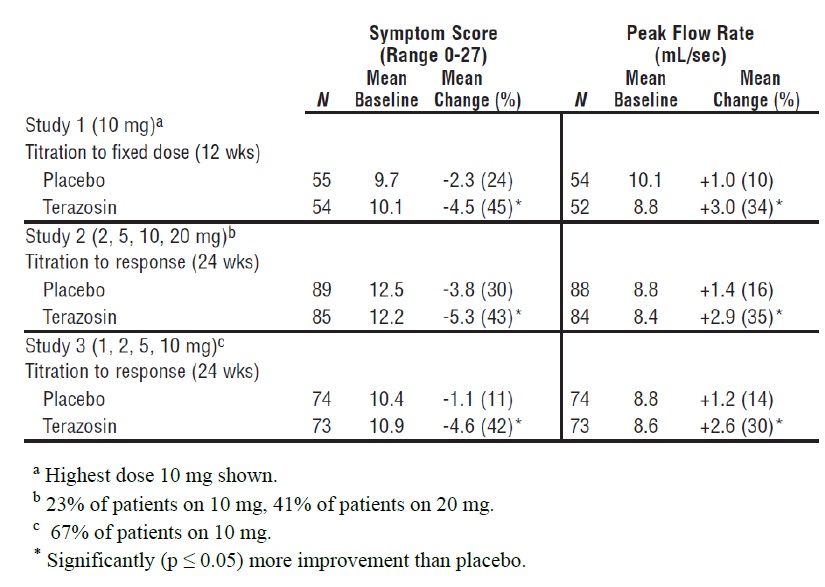
A comparative data table showing results from three terazosin studies. It reports mean baseline and change percentages for symptom scores (0-27 range) and peak flow rates (mL/sec) for terazosin versus placebo over various dosages and durations, with statistical notes on significance and dosage details.*
FDA Label Image

Image (98351704 9ff8 4c54 A2c2 E2841873d658 03)

Image (98351704 9ff8 4c54 A2c2 E2841873d658 03)
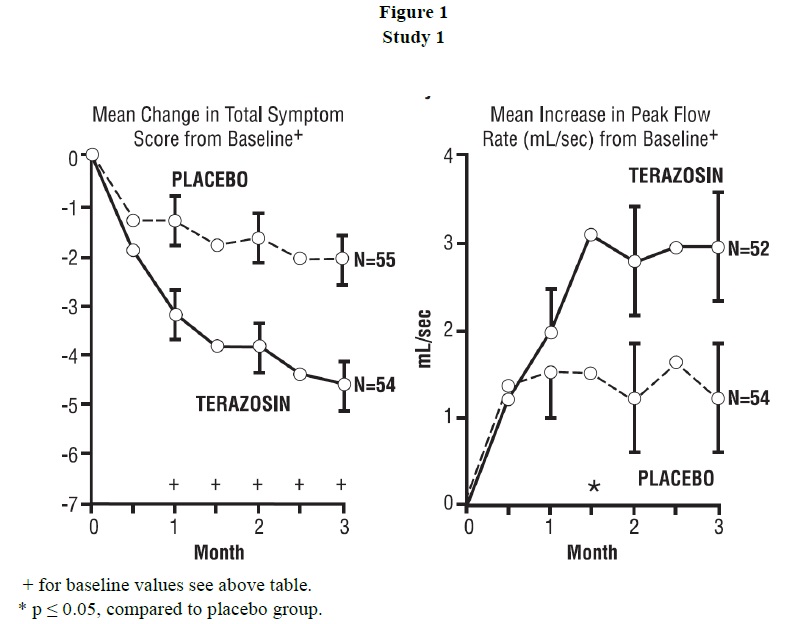
Figure 1 from Study 1 shows two line graphs comparing terazosin and placebo over 3 months. The left graph depicts mean change in total symptom score from baseline, with terazosin showing greater symptom reduction than placebo. The right graph shows mean increase in peak flow rate (mL/sec) from baseline, where terazosin demonstrates a higher increase compared to placebo. Sample sizes range from 52 to 55 per group.*
FDA Label Image

Image (98351704 9ff8 4c54 A2c2 E2841873d658 04)

Image (98351704 9ff8 4c54 A2c2 E2841873d658 04)
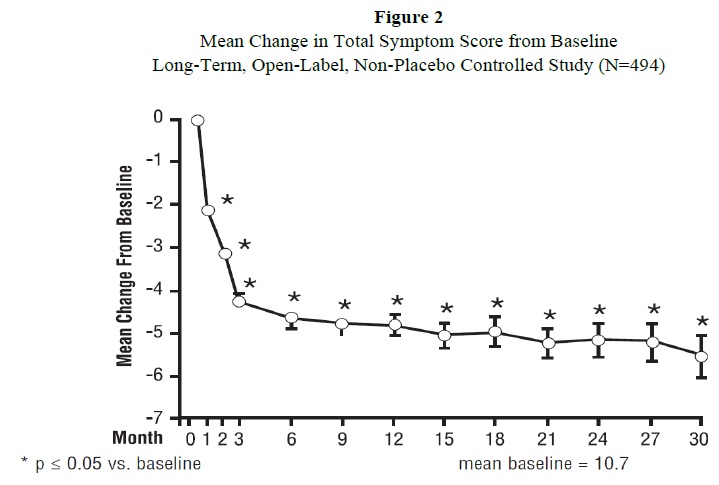
A line chart titled 'Mean Change in Total Symptom Score from Baseline' from a long-term, open-label, non-placebo controlled study with 494 participants. The x-axis represents months (0 to 30), and the y-axis shows mean change from baseline (0 to -7). The data points illustrate a decreasing symptom score over time, with significant changes marked by asterisks throughout the timeline.*
FDA Label Image

Image (98351704 9ff8 4c54 A2c2 E2841873d658 05)

Image (98351704 9ff8 4c54 A2c2 E2841873d658 05)
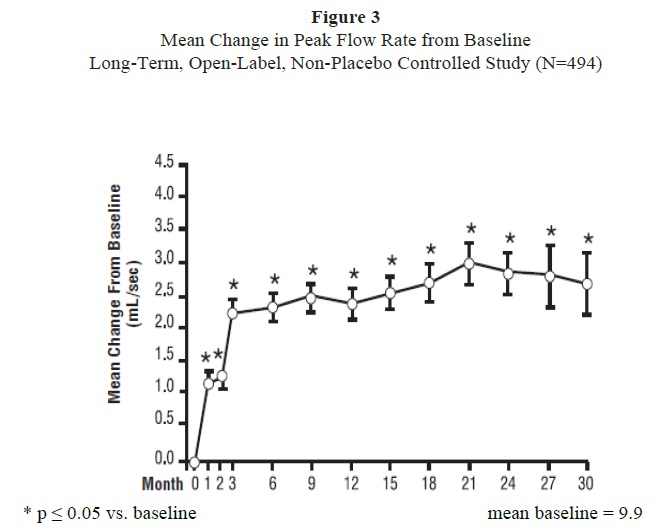
A line graph titled 'Mean Change in Peak Flow Rate from Baseline' from a long-term, open-label, non-placebo controlled study with 494 participants. The graph shows the mean change from baseline (in mL/sec) on the vertical axis over 30 months on the horizontal axis. Data points with error bars show an increasing trend in peak flow rate over time, with statistically significant changes from baseline indicated by asterisks at multiple time points.*
FDA Label Image

Image (98351704 9ff8 4c54 A2c2 E2841873d658 06)

Image (98351704 9ff8 4c54 A2c2 E2841873d658 06)
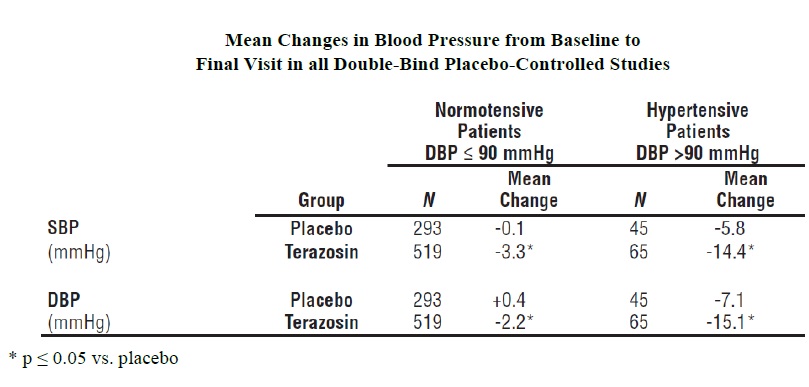
This data table displays mean changes in blood pressure (SBP and DBP in mmHg) from baseline to final visit in double-blind, placebo-controlled studies. It compares normotensive patients (DBP ≤ 90 mmHg) and hypertensive patients (DBP > 90 mmHg) treated with terazosin versus placebo, including sample sizes (N) and significance levels (p ≤ 0.05).*
FDA Label Image

Image (98351704 9ff8 4c54 A2c2 E2841873d658 07)

Image (98351704 9ff8 4c54 A2c2 E2841873d658 07)
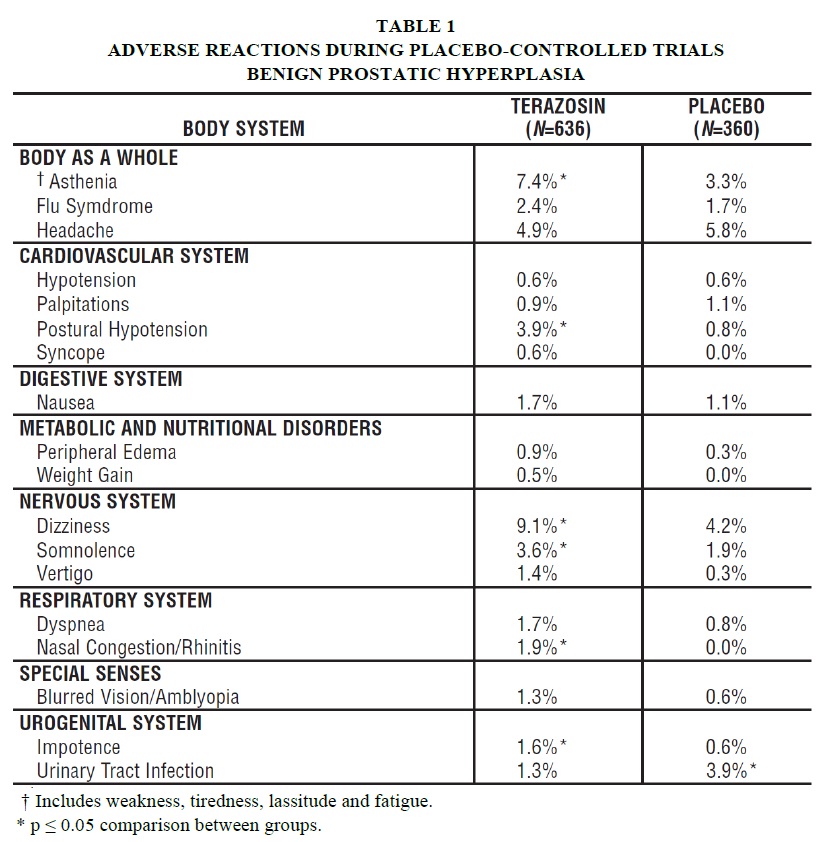
Data table titled 'Adverse Reactions During Placebo-Controlled Trials Benign Prostatic Hyperplasia' showing the incidence percentages of various adverse reactions by body system for terazosin (N=636) and placebo (N=360) groups. Adverse reactions listed include asthenia, flu syndrome, headache, cardiovascular events, nausea, edema, dizziness, dyspnea, blurred vision, impotence, and urinary tract infection, among others. Statistically significant differences (p ≤ 0.05) are marked for several reactions.*
FDA Label Image

Image (98351704 9ff8 4c54 A2c2 E2841873d658 08)

Image (98351704 9ff8 4c54 A2c2 E2841873d658 08)
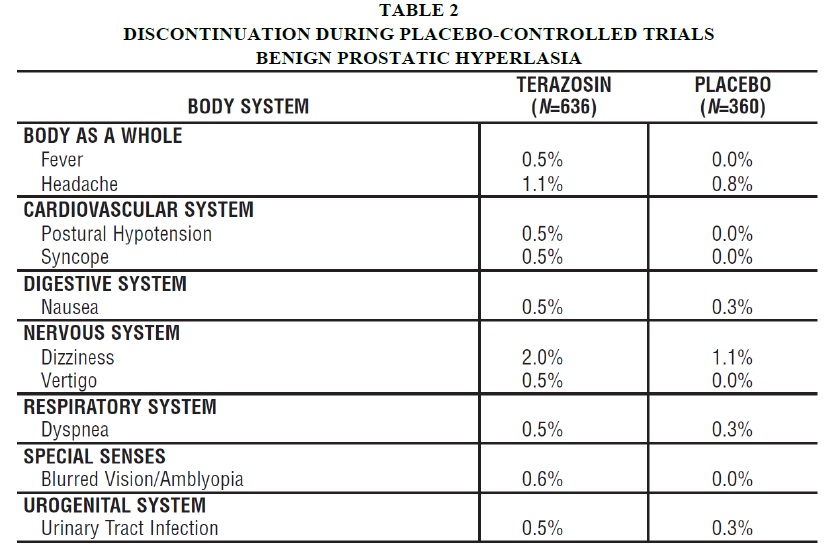
A data table titled 'Discontinuation During Placebo-Controlled Trials Benign Prostatic Hyperplasia' comparing adverse events by body system between terazosin (N=636) and placebo (N=360). It lists percentages of patients reporting issues such as fever, headache, postural hypotension, syncope, nausea, dizziness, vertigo, dyspnea, blurred vision, and urinary tract infection during the trials.*
FDA Label Image

Image (98351704 9ff8 4c54 A2c2 E2841873d658 09)

Image (98351704 9ff8 4c54 A2c2 E2841873d658 09)
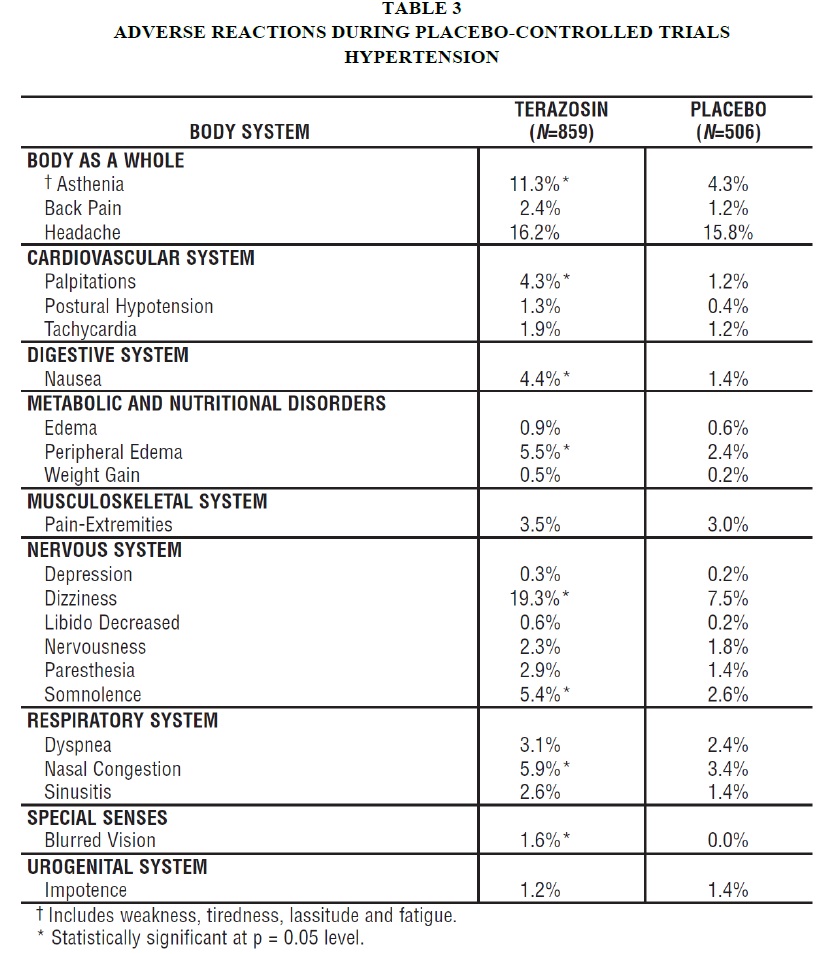
Table presenting adverse reactions during placebo-controlled trials for hypertension comparing terazosin (N=859) and placebo (N=506). It lists body system categories with associated side effects and their incidence percentages for terazosin versus placebo, including statistically significant differences marked by asterisks. Body systems covered include body as a whole, cardiovascular, digestive, metabolic and nutritional disorders, musculoskeletal, nervous, respiratory, special senses, and urogenital.*
FDA Label Image

Image (98351704 9ff8 4c54 A2c2 E2841873d658 10)

Image (98351704 9ff8 4c54 A2c2 E2841873d658 10)
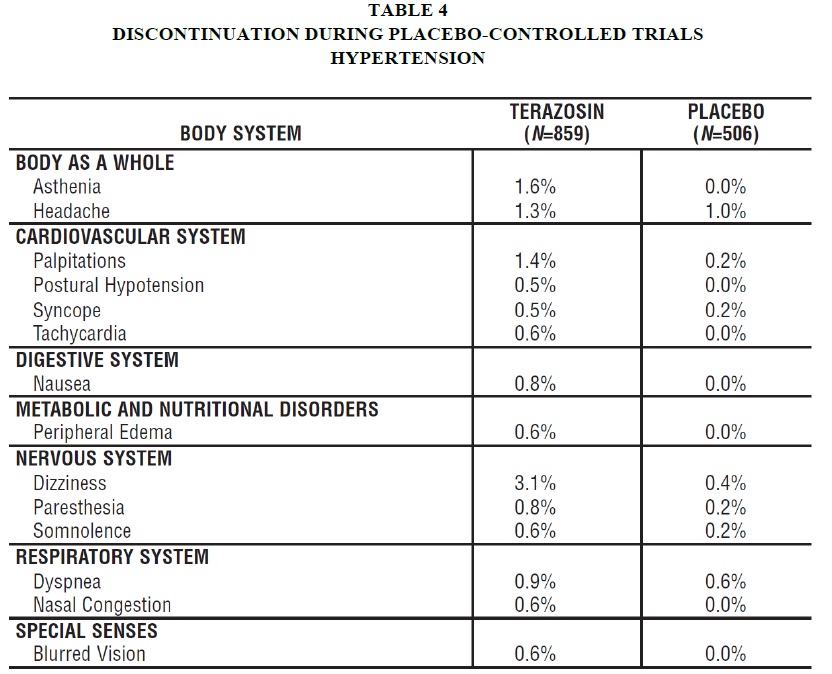
A table labeled 'Discontinuation During Placebo-Controlled Trials Hypertension' comparing the percentage of patients discontinuing treatment due to various side effects under body systems for terazosin (N=859) and placebo (N=506). It lists adverse events by body system including body as a whole, cardiovascular, digestive, metabolic and nutritional disorders, nervous, respiratory, and special senses, with percentages for terazosin and placebo groups.*
FDA Label Image

Image (98351704 9ff8 4c54 A2c2 E2841873d658 11)

FDA Label Image

Image (98351704 9ff8 4c54 A2c2 E2841873d658 12)

FDA Label Image

Aphena (Aphena)

* About these descriptions: Image descriptions on this page are generated by automated AI analysis of the product label images from the manufacturer's FDA label submission (SPL). They are provided for reference only and may contain errors or omissions. Always rely on the printed label itself and the official FDA labeling, and consult a pharmacist or healthcare professional with any questions about this product.