Sildenafil Citrate Tablet
Product Images NDC 53401-046

10 FDA label images from Aphena Pharma Solutions - Tennessee, Llc · Packaging, Regulatory Labels, and Product Appearance

Product Visual Gallery

This gallery contains 10 technical images submitted to the FDA as part of the official labeling for Sildenafil Citrate (NDC 53401-046). Unlike standard consumer photos, these assets often include clinical data figures, molecular chemical structures, and official manufacturer packaging layouts.

As provided by Aphena Pharma Solutions - Tennessee, Llc, these visuals offer a comprehensive scientific overview of the product's physical and chemical identity, aiding pharmacists and researchers in product verification and study.

FDA Label Image

Sildenafil-citrate-structure (Sildenafil Citrate Structure)
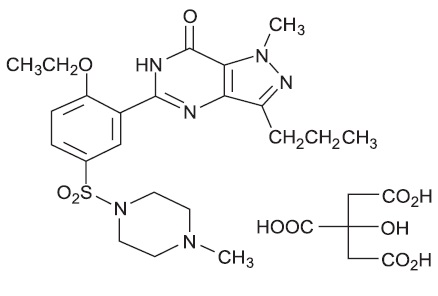
Sildenafil-citrate-structure (Sildenafil Citrate Structure)
Chemical structure diagram of sildenafil citrate, showing its molecular components including aromatic rings, heterocyclic rings, and carboxylic acid groups.*
FDA Label Image

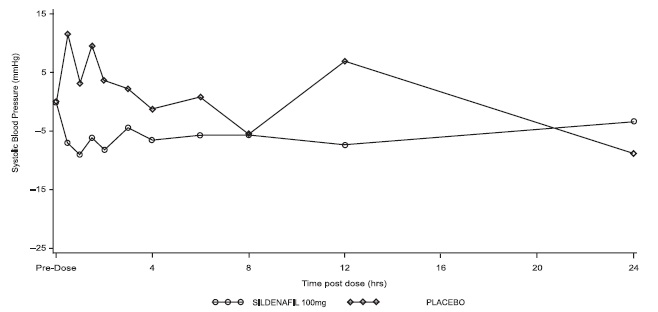
Sildenafil-citrate-figure-1 (Sildenafil Citrate Figure 1)

Sildenafil-citrate-figure-1 (Sildenafil Citrate Figure 1)
A line graph comparing systolic blood pressure changes over 24 hours between Sildenafil 100 mg and placebo. The x-axis shows time post dose in hours, and the y-axis shows systolic blood pressure in mmHg. Two lines represent the measurements for Sildenafil and placebo groups over time.*
FDA Label Image

Sildenafil-citrate-figure-2 (Sildenafil Citrate Figure 2)

Sildenafil-citrate-figure-2 (Sildenafil Citrate Figure 2)
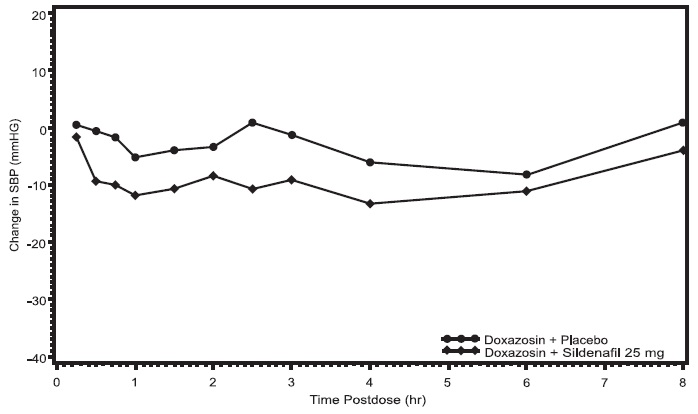
A line graph showing the change in systolic blood pressure (SBP) in mmHg over time postdose up to 8 hours. It compares two treatments: Doxazosin plus placebo and Doxazosin plus Sildenafil 25 mg, illustrating their effects on SBP changes across the time points.*
FDA Label Image

Sildenafil-citrate-figure-3 (Sildenafil Citrate Figure 3)

Sildenafil-citrate-figure-3 (Sildenafil Citrate Figure 3)
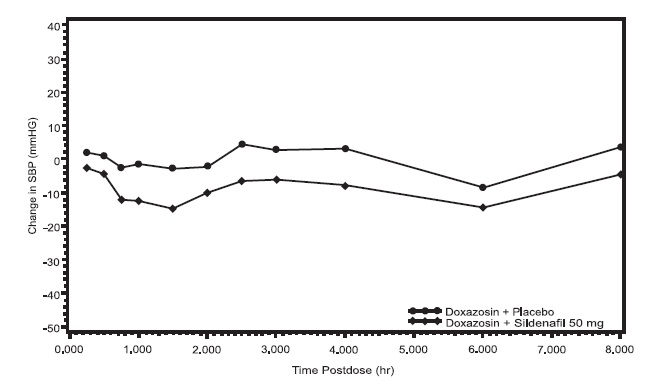
A line graph illustrating the change in systolic blood pressure (SBP) in mmHg over time postdose in hours, comparing Doxazosin plus Placebo and Doxazosin plus Sildenafil 50 mg treatments. The graph shows the SBP changes from 0 to 8 hours postdose with two comparative lines representing each treatment group.*
FDA Label Image

Sildenafil-citrate-figure-4 (Sildenafil Citrate Figure 4)

Sildenafil-citrate-figure-4 (Sildenafil Citrate Figure 4)
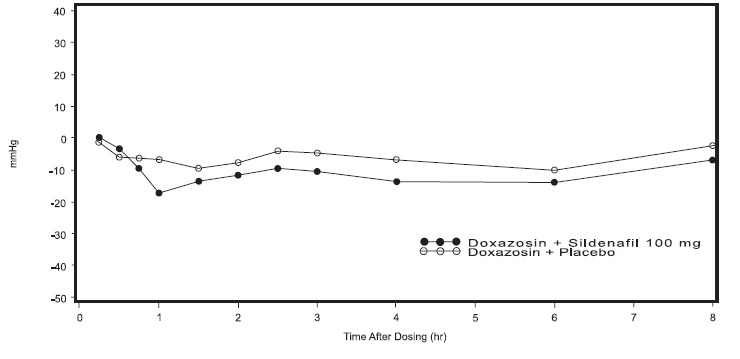
A line graph showing the change in mmHg over time after dosing (0 to 8 hours) comparing two treatments: Doxazosin with Sildenafil 100 mg and Doxazosin with Placebo. The graph illustrates the blood pressure changes post-dose with time on the x-axis and mmHg on the y-axis, including data points represented with filled and open circles for each treatment respectively.*
FDA Label Image

Sildenafil-citrate-figure-5 (Sildenafil Citrate Figure 5)

Sildenafil-citrate-figure-5 (Sildenafil Citrate Figure 5)
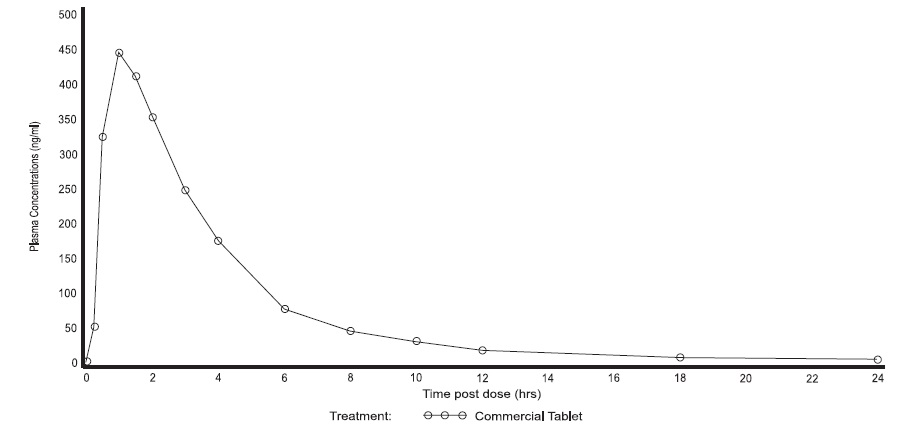
A line graph depicting plasma concentrations of sildenafil citrate over time after oral administration of a commercial tablet. The x-axis represents time post dose in hours from 0 to 24, and the y-axis shows plasma concentrations in ng/ml up to 500. The curve peaks around 1-2 hours and steadily declines thereafter, showing concentration levels at multiple time points for the commercial tablet treatment.*
FDA Label Image

Sildenafil-citrate-figure-6 (Sildenafil Citrate Figure 6)

Sildenafil-citrate-figure-6 (Sildenafil Citrate Figure 6)
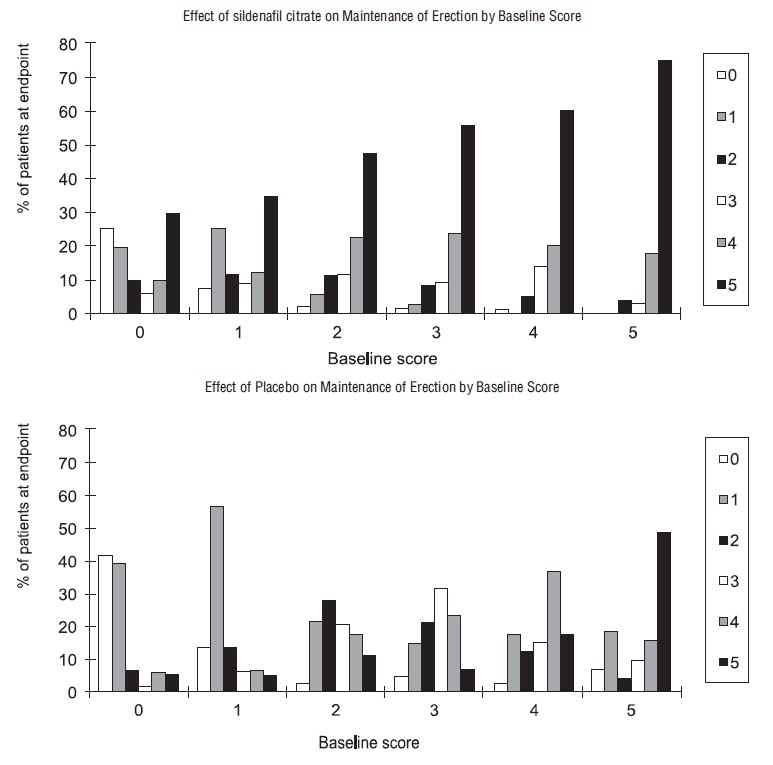
Two grouped bar charts showing the effect of sildenafil citrate versus placebo on maintenance of erection by baseline score. Each chart displays the percentage of patients at endpoint across baseline scores 0 to 5, with categories 0 through 5 indicated by different shaded bars. The top chart represents sildenafil citrate, and the bottom chart represents placebo, illustrating patient response distribution for each baseline score.*
FDA Label Image

Sildenafil-citrate-figure-7 (Sildenafil Citrate Figure 7)

Sildenafil-citrate-figure-7 (Sildenafil Citrate Figure 7)
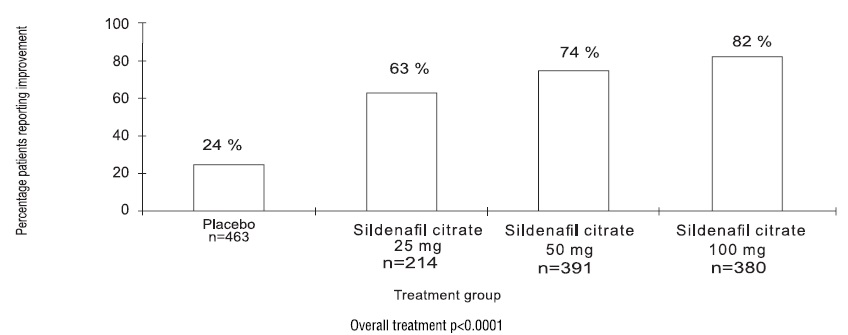
A bar chart comparing the percentage of patients reporting improvement in different treatment groups: placebo, sildenafil citrate 25 mg, 50 mg, and 100 mg. The percentages increase with higher doses of sildenafil citrate, showing 24% for placebo, 63% for 25 mg, 74% for 50 mg, and 82% for 100 mg. The chart includes sample sizes for each group and an overall treatment significance of p<0.0001.*
FDA Label Image

Aphena (Aphena)

FDA Label Image

Label (53401 0046 52)

Label (53401 0046 52)
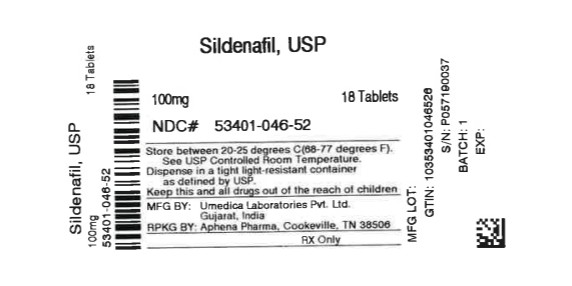
Label for Sildenafil, USP 100 mg oral tablets. The label shows a quantity of 18 tablets. The NDC number listed is 53401-046-52. Manufacturer is Umedica Laboratories Pvt. Ltd., Gujarat, India. The labeler and repackager is Aphena Pharma Solutions, Cookeville, TN. Storage instructions specify controlled room temperature. The packaging indicates the product is for prescription use only (RX only).*

* About these descriptions: Image descriptions on this page are generated by automated AI analysis of the product label images from the manufacturer's FDA label submission (SPL). They are provided for reference only and may contain errors or omissions. Always rely on the printed label itself and the official FDA labeling, and consult a pharmacist or healthcare professional with any questions about this product.