Carvedilol
Product Images NDC 53808-0220

View Photos of Packaging, Regulatory Labels, and Product Appearance

Product Visual Gallery

This gallery contains 4 technical images submitted to the FDA as part of the official labeling for Carvedilol (NDC 53808-0220). Unlike standard consumer photos, these assets often include clinical data figures, molecular chemical structures, and official manufacturer packaging layouts.

As provided by State Of Florida Doh Central Pharmacy, these visuals offer a comprehensive scientific overview of the product's physical and chemical identity, aiding pharmacists and researchers in product verification and study.

FDA Label Image

Structured Formula For Carvedilol (Carvedilol12.5mg(zydus))

Structured Formula For Carvedilol (Carvedilol12.5mg(zydus))
Label for Carvedilol 12.5 mg tablets packaged by DOH Central Pharmacy, Tallahassee, FL. The label indicates a quantity of 30 tablets and includes a lot number (MJ4935) and expiration date (04/30/10). The label features a barcode and states "RX Only."*
FDA Label Image

Structured Formula For Carvedilol (Carvediloltablets Figure 01)

Structured Formula For Carvedilol (Carvediloltablets Figure 01)
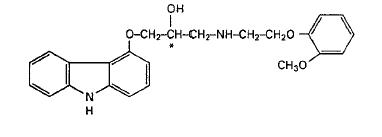
Chemical structure of Carvedilol showing its molecular composition with various functional groups, including hydroxyl, ether, amine, and methoxyphenyl moieties, depicted with connected atoms and bonds in a skeletal formula.*
FDA Label Image

Structured Formula For Carvedilol (Carvediloltablets Figure 02)

Structured Formula For Carvedilol (Carvediloltablets Figure 02)
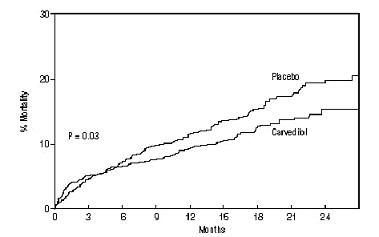
A Kaplan-Meier survival curve graph comparing mortality percentages over 24 months between Carvedilol and placebo groups. The x-axis represents time in months, and the y-axis represents percentage mortality. The graph shows lower mortality for the Carvedilol group versus placebo, with a P-value of 0.03 indicating statistical significance.*
FDA Label Image

Structured Formula For Carvedilol (Carvediloltablets Figure 03)

Structured Formula For Carvedilol (Carvediloltablets Figure 03)
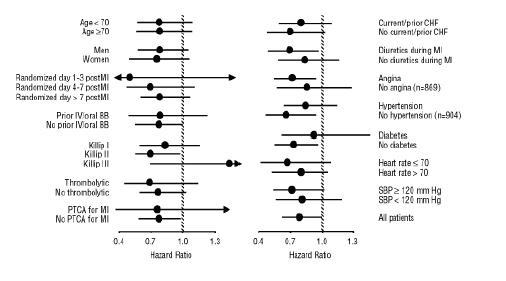
A forest plot depicting hazard ratios comparing various patient subgroups, such as age, gender, prior medication use, comorbid conditions, and vital sign categories. The plot shows points with confidence intervals for each subgroup across two panels, likely illustrating comparative risk related to the use of a drug in different clinical scenarios.*

* About these descriptions: Image descriptions on this page are generated by automated AI analysis of the product label images from the manufacturer's FDA label submission (SPL). They are provided for reference only and may contain errors or omissions. Always rely on the printed label itself and the official FDA labeling, and consult a pharmacist or healthcare professional with any questions about this product.