Clopidogrel
Product Images NDC 53808-0616

View Photos of Packaging, Regulatory Labels, and Product Appearance

Product Visual Gallery

This gallery contains 10 technical images submitted to the FDA as part of the official labeling for Clopidogrel (NDC 53808-0616). Unlike standard consumer photos, these assets often include clinical data figures, molecular chemical structures, and official manufacturer packaging layouts.

As provided by State Of Florida Doh Central Pharmacy, these visuals offer a comprehensive scientific overview of the product's physical and chemical identity, aiding pharmacists and researchers in product verification and study.

FDA Label Image

Package Label-principal Display Panel (75 mg (30 Tablet Bottle))

Package Label-principal Display Panel (75 mg (30 Tablet Bottle))
Packaging label for Clopidogrel 75 mg tablets, quantity 60, labeled by State of Florida DOH Central Pharmacy, Tallahassee, FL. The label includes lot number YF512034-A, expiration date 03/31/2013, and barcode with UPC 365862357052.*
FDA Label Image

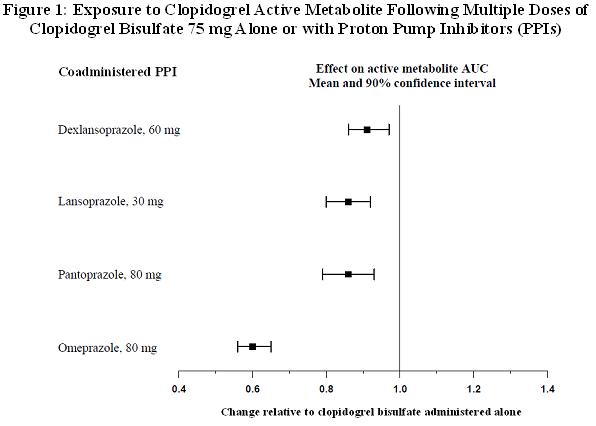
Figure 1: Exposure To Clopidogrel Active Metabolite Following Multiple Doses Of Clopidogrel Bisulfate 75 mg Alone Or With Proton Pump Inhibitors (ppis) (Clopidogrel Fig1)

Figure 1: Exposure To Clopidogrel Active Metabolite Following Multiple Doses Of Clopidogrel Bisulfate 75 mg Alone Or With Proton Pump Inhibitors (ppis) (Clopidogrel Fig1)
A horizontal error bar chart showing the effect of coadministered proton pump inhibitors (PPIs) on exposure to Clopidogrel active metabolite after multiple doses of Clopidogrel bisulfate 75 mg. The chart compares four PPIs: Dexlansoprazole 60 mg, Lansoprazole 30 mg, Pantoprazole 80 mg, and Omeprazole 80 mg, with mean and 90% confidence intervals of active metabolite AUC, relative to Clopidogrel bisulfate administered alone.*
FDA Label Image

Figure 2: Cardiovascular Death, Myocardial Infarction, And Stroke In The Cure Study (Clopidogrel Fig2)

Figure 2: Cardiovascular Death, Myocardial Infarction, And Stroke In The Cure Study (Clopidogrel Fig2)
A line graph titled 'Cardiovascular Death, Myocardial Infarction, and Stroke in the CURE Study' showing cumulative event rates over 12 months of follow-up. It compares event rates between placebo (+ aspirin) and clopidogrel bisulfate (+ aspirin) groups, with the clopidogrel group showing lower event rates. A p-value (0.00009) indicates statistical significance.*
FDA Label Image

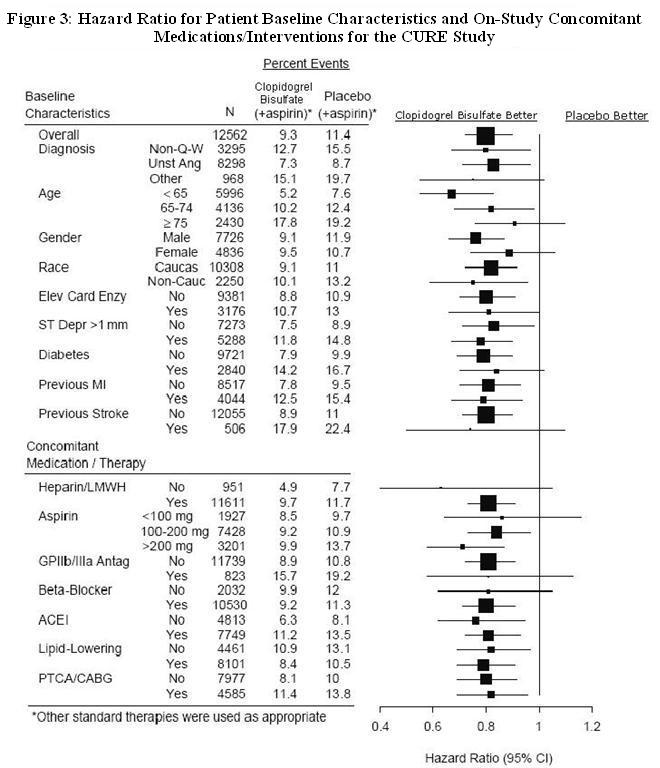
Figure 3: Hazard Ratio For Patient Baseline Characteristics And On-study Concomitant Medications/interventions For The Cure Study (Clopidogrel Fig3)

Figure 3: Hazard Ratio For Patient Baseline Characteristics And On-study Concomitant Medications/interventions For The Cure Study (Clopidogrel Fig3)
A forest plot chart displaying hazard ratios for patient baseline characteristics and on-study concomitant medications/interventions for the CURE study. The chart compares percent events between Clopidogrel Bisulfate (+aspirin) and placebo (+aspirin) across various factors including diagnosis, age, gender, race, diabetes, previous medical conditions, and concurrent therapies. The hazard ratio scale ranges from 0.4 to 1.2, indicating relative benefits of Clopidogrel Bisulfate or placebo.*
FDA Label Image

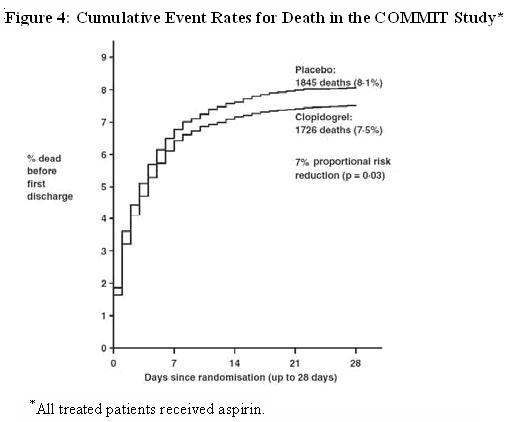
Figure 4: Cumulative Event Rates For Death In The Commit Study* (Clopidogrel Fig4)

Figure 4: Cumulative Event Rates For Death In The Commit Study* (Clopidogrel Fig4)
A cumulative event rates chart showing percentage of death before first discharge over days since randomization (up to 28 days) from the COMMIT study. The graph compares two groups: Placebo with 1845 deaths (8.1%) and Clopidogrel with 1726 deaths (7.5%), indicating a 7% proportional risk reduction for Clopidogrel (p = 0.03). A footnote states that all treated patients received aspirin.*
FDA Label Image

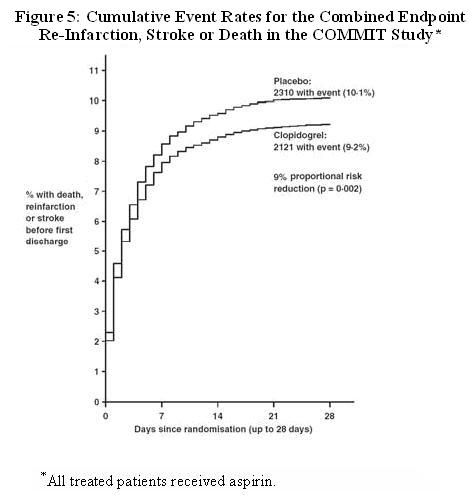
Figure 5: Cumulative Event Rates For The Combined Endpoint Re-infarction, Stroke Or Death In The Commit Study* (Clopidogrel Fig5)

Figure 5: Cumulative Event Rates For The Combined Endpoint Re-infarction, Stroke Or Death In The Commit Study* (Clopidogrel Fig5)
A line graph showing cumulative event rates (%) of death, reinfarction, or stroke over 28 days in the COMMIT study. It compares Placebo with 10.1% events and Clopidogrel with 9.2% events, noting a 9% proportional risk reduction (p=0.002). All treated patients received aspirin.*
FDA Label Image

Figure 6: Effects Of Adding Clopidogrel Bisulfate To Aspirin On The Combined Primary Endpoint Across Baseline And Concomitant Medication Subgroups For The Commit Study (Clopidogrel Fig6)

Figure 6: Effects Of Adding Clopidogrel Bisulfate To Aspirin On The Combined Primary Endpoint Across Baseline And Concomitant Medication Subgroups For The Commit Study (Clopidogrel Fig6)
A forest plot figure illustrating the effects of adding Clopidogrel Bisulfate to aspirin on combined primary endpoints across various baseline and medication subgroups in the COMMIT study. The chart compares event percentages between clopidogrel and placebo groups, showing odds ratios with confidence intervals for categories such as sex, age, time since onset, blood pressure, heart rate, fibrinolytic agent use, prognostic index, and metoprolol allocation.*
FDA Label Image

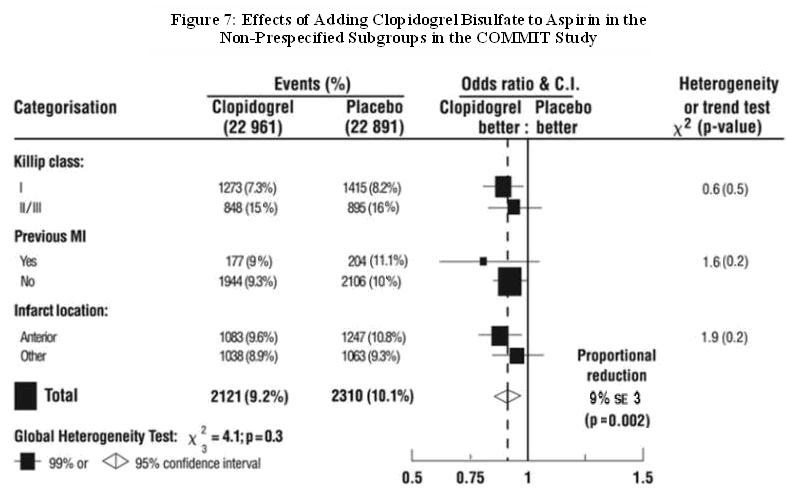
Figure 7: Effects Of Adding Clopidogrel Bisulfate To Aspirin In The Non-prespecified Subgroups In The Commit Study (Clopidogrel Fig7)

Figure 7: Effects Of Adding Clopidogrel Bisulfate To Aspirin In The Non-prespecified Subgroups In The Commit Study (Clopidogrel Fig7)
A forest plot figure titled 'Effects of Adding Clopidogrel Bisulfate to Aspirin in the Non-Prespecified Subgroups in the COMMIT Study.' It displays event percentages and odds ratios with confidence intervals comparing Clopidogrel and placebo groups across subgroups by Killip class, previous myocardial infarction, and infarct location. The plot includes markers and a summary diamond indicating a proportional reduction of 9% with statistical significance (p=0.002).*
FDA Label Image

Figure 8: Fatal Or Non-fatal Vascular Events In The Caprie Study (Clopidogrel Fig8)

Figure 8: Fatal Or Non-fatal Vascular Events In The Caprie Study (Clopidogrel Fig8)
A line graph titled 'Fatal or Non-Fatal Vascular Events in the CAPRIE Study' showing cumulative event rates (%) on the y-axis against months of follow-up (0 to 36) on the x-axis. Two lines represent event rates for Aspirin and Clopidogrel Bisulfate, with the Clopidogrel line consistently below the Aspirin line. The graph includes a p-value of 0.045.*
FDA Label Image

Chemical Structure (Clopidogrel Str)

Chemical Structure (Clopidogrel Str)
Chemical structure diagram of Clopidogrel, showing its molecular framework including a thiophene ring, chlorophenyl group, and methyl ester functional groups, along with the presence of sulfuric acid (H2SO4).*

* About these descriptions: Image descriptions on this page are generated by automated AI analysis of the product label images from the manufacturer's FDA label submission (SPL). They are provided for reference only and may contain errors or omissions. Always rely on the printed label itself and the official FDA labeling, and consult a pharmacist or healthcare professional with any questions about this product.