Crixivan
Product Images NDC 53808-0661

9 FDA label images from State Of Florida Doh Central Pharmacy · Packaging, Regulatory Labels, and Product Appearance

Product Visual Gallery

This gallery contains 9 technical images submitted to the FDA as part of the official labeling for Crixivan (NDC 53808-0661). Unlike standard consumer photos, these assets often include clinical data figures, molecular chemical structures, and official manufacturer packaging layouts.

As provided by State Of Florida Doh Central Pharmacy, these visuals offer a comprehensive scientific overview of the product's physical and chemical identity, aiding pharmacists and researchers in product verification and study.

FDA Label Image

Bottle Label (400 mg)

Bottle Label (400 mg)
Label for CRIXIVAN 400 mg capsules, showing a quantity of 30. The label indicates the product is RX Only and is labeled by State of Florida DOH Central Pharmacy, Tallahassee, FL. Manufacturer is Merck & Co. and the label includes lot and expiration date information, along with a UPC barcode.*
FDA Label Image

Structural Formula (C8e77806 79bf 4d9b 8314 F449c653d87c 01)

Structural Formula (C8e77806 79bf 4d9b 8314 F449c653d87c 01)
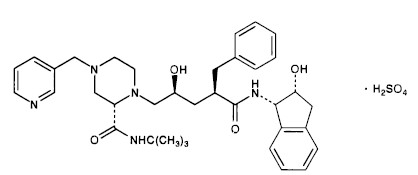
Chemical structure diagram of the active ingredient in CRIXIVAN, showing a complex molecule with aromatic rings, hydroxyl groups, and amide linkages, alongside a sulfate (H2SO4) component.*
FDA Label Image

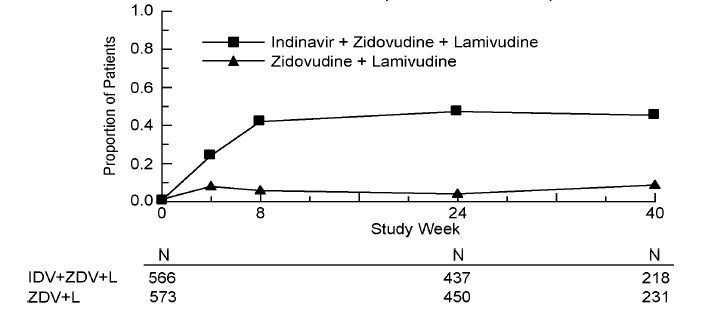
Indinavir Protocol Figure 1 (C8e77806 79bf 4d9b 8314 F449c653d87c 02)

Indinavir Protocol Figure 1 (C8e77806 79bf 4d9b 8314 F449c653d87c 02)
A line graph showing the proportion of patients over study weeks comparing two treatment groups: Indinavir + Zidovudine + Lamivudine and Zidovudine + Lamivudine. The y-axis represents the proportion of patients, and the x-axis shows study weeks (0, 8, 24, 40). Patient numbers for each group at each time point are listed below the x-axis.*
FDA Label Image

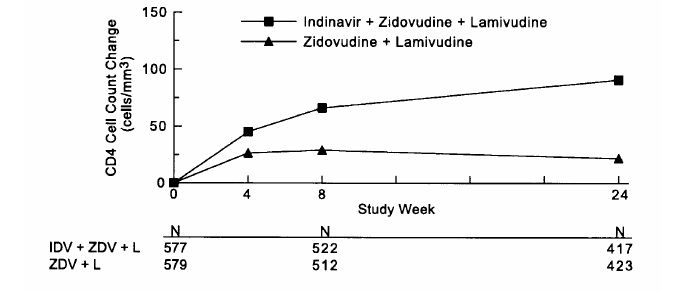
Cd4 Cell Counts Figure 2 (Study ACTG 320)

Cd4 Cell Counts Figure 2 (Study ACTG 320)
A line graph showing CD4 cell count change (cells/mm3) over study weeks (0, 4, 8, 24). Two groups are compared: Indinavir + Zidovudine + Lamivudine, and Zidovudine + Lamivudine. The group with Indinavir exhibits a higher increase in CD4 cell count over time. Sample sizes at weeks 0, 4, 8, and 24 for each group are listed below the x-axis.*
FDA Label Image

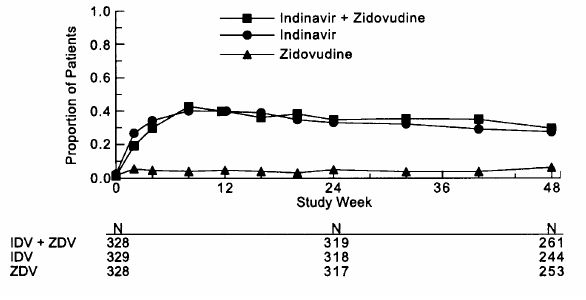
Indinavir Protocol 028 Figure 3 (C8e77806 79bf 4d9b 8314 F449c653d87c 04)

Indinavir Protocol 028 Figure 3 (C8e77806 79bf 4d9b 8314 F449c653d87c 04)
A line graph showing the proportion of patients over a 48-week study period comparing three groups: Indinavir + Zidovudine, Indinavir alone, and Zidovudine alone. The X-axis represents study weeks, and the Y-axis represents the proportion of patients. Data points and legend distinguish the three treatment groups. Patient numbers at specific weeks are listed below the graph.*
FDA Label Image

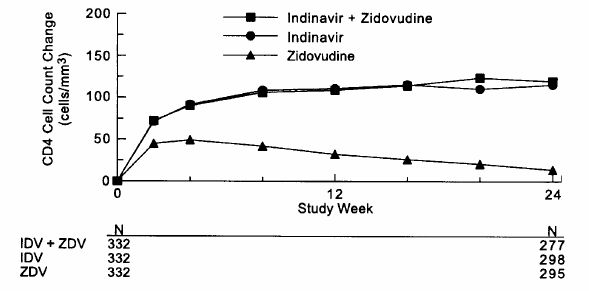
Indinavir Protocol 028 Figure 4 (C8e77806 79bf 4d9b 8314 F449c653d87c 05)

Indinavir Protocol 028 Figure 4 (C8e77806 79bf 4d9b 8314 F449c653d87c 05)
A line graph depicting CD4 cell count change (cells/mm³) over 24 study weeks for three treatments: Indinavir + Zidovudine, Indinavir alone, and Zidovudine alone. The X-axis represents study weeks (0, 12, 24) and the Y-axis shows CD4 cell count change from 0 to 200. The graph shows increasing CD4 counts with Indinavir and combination therapy, while Zidovudine alone declines over time. A small table below shows sample sizes for each group at baseline and study end.*
FDA Label Image

Indinavir Protocol 035 Figure 5 (C8e77806 79bf 4d9b 8314 F449c653d87c 06)

Indinavir Protocol 035 Figure 5 (C8e77806 79bf 4d9b 8314 F449c653d87c 06)
A line graph showing RNA change (Log10 copies/mL) over 24 study weeks. It compares three treatment groups: Indinavir + Zidovudine + Lamivudine, Indinavir alone, and Zidovudine + Lamivudine. The graph tracks RNA reduction trends for each group with study weeks on the x-axis and RNA change on the y-axis, accompanied by a small table below indicating sample sizes at various time points.*
FDA Label Image

Indinavir Protocol 035 Figure 6 (C8e77806 79bf 4d9b 8314 F449c653d87c 07)

Indinavir Protocol 035 Figure 6 (C8e77806 79bf 4d9b 8314 F449c653d87c 07)
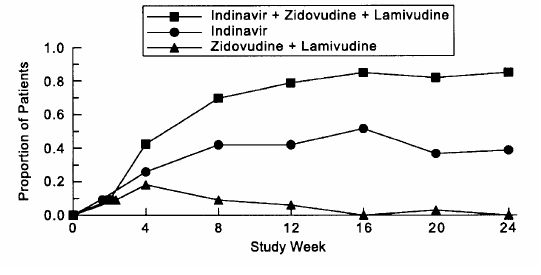
A line graph showing the proportion of patients over a 24-week study period. The graph compares three treatment groups: Indinavir plus Zidovudine plus Lamivudine, Indinavir alone, and Zidovudine plus Lamivudine. The x-axis represents study weeks, and the y-axis shows the proportion of patients, ranging from 0.0 to 1.0.*
FDA Label Image

Indinavir Protocol 035 Figure 7 (C8e77806 79bf 4d9b 8314 F449c653d87c 08)

Indinavir Protocol 035 Figure 7 (C8e77806 79bf 4d9b 8314 F449c653d87c 08)
A line graph showing CD4 cell count change (cells/mm3) over 24 weeks of study. It compares three treatment groups: Indinavir plus Zidovudine and Lamivudine, Indinavir alone, and Zidovudine plus Lamivudine. The graph includes data points and respective labels for each group, with an N value table indicating the number of subjects per group at various weeks.*

* About these descriptions: Image descriptions on this page are generated by automated AI analysis of the product label images from the manufacturer's FDA label submission (SPL). They are provided for reference only and may contain errors or omissions. Always rely on the printed label itself and the official FDA labeling, and consult a pharmacist or healthcare professional with any questions about this product.