Renagel
Product Images NDC 53808-0777

4 FDA label images from Doh Central Pharmacy · Packaging, Regulatory Labels, and Product Appearance

Product Visual Gallery

This gallery contains 4 technical images submitted to the FDA as part of the official labeling for Renagel (NDC 53808-0777). Unlike standard consumer photos, these assets often include clinical data figures, molecular chemical structures, and official manufacturer packaging layouts.

As provided by Doh Central Pharmacy, these visuals offer a comprehensive scientific overview of the product's physical and chemical identity, aiding pharmacists and researchers in product verification and study.

FDA Label Image

800mg Label (Renagel 800mg(genzyme))

800mg Label (Renagel 800mg(genzyme))
Label for Renagel 800 mg tablets, quantity 30, labeled as prescription only. Packaging by DOH Central Pharmacy in Tallahassee, FL. The label includes the lot number T267A09A and an expiration date of 01/31/11. A barcode and UPC 358468002112 are shown.*
FDA Label Image

Figure 1. Chemical Structure Of Sevelamer Hydrochloride (Renagel Figure 1)

Figure 1. Chemical Structure Of Sevelamer Hydrochloride (Renagel Figure 1)
Chemical structure diagram showing a complex polymer with amino and hydrochloride groups, along with hydroxyl functional groups, likely representing the active ingredient's molecular structure related to the product Renagel by DOH CENTRAL PHARMACY.*
FDA Label Image

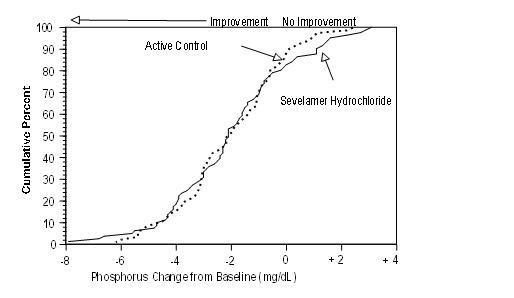
Figure 2. Cumulative Percent Of Patients (y-axis) Attaining A Phosphorus Change From Baseline At Least As Great As The Value Of The X-axis. A Shift To The Left Of A Curve Indicates A Better Response. (Renagel Figure 2)

Figure 2. Cumulative Percent Of Patients (y-axis) Attaining A Phosphorus Change From Baseline At Least As Great As The Value Of The X-axis. A Shift To The Left Of A Curve Indicates A Better Response. (Renagel Figure 2)
A cumulative percentage plot showing the change in phosphorus levels from baseline (mg/dL) comparing Sevelamer Hydrochloride with an Active Control. The X-axis represents phosphorus change from -8 to +4 mg/dL, and the Y-axis represents cumulative percent from 0 to 100%. Markers indicate improvement and no improvement regions.*
FDA Label Image

Figure 3. Mean Phosphorus Change From Baseline For Patients Who Completed 52 Weeks Of Treatment (Renagel Figure 3)

Figure 3. Mean Phosphorus Change From Baseline For Patients Who Completed 52 Weeks Of Treatment (Renagel Figure 3)
A line graph showing the percent change from baseline in serum phosphorus over a 52-week study period. Two treatments are compared: Sevelamer Hydrochloride and an Active Control. The x-axis represents study weeks, and the y-axis shows percent change from baseline, with Sevelamer Hydrochloride generally maintaining lower phosphorus levels throughout the study.*

* About these descriptions: Image descriptions on this page are generated by automated AI analysis of the product label images from the manufacturer's FDA label submission (SPL). They are provided for reference only and may contain errors or omissions. Always rely on the printed label itself and the official FDA labeling, and consult a pharmacist or healthcare professional with any questions about this product.