Clopidogrel Bisulfate
Product Images NDC 53808-0806

View Photos of Packaging, Regulatory Labels, and Product Appearance

Product Visual Gallery

This gallery contains 10 technical images submitted to the FDA as part of the official labeling for Clopidogrel Bisulfate (NDC 53808-0806). Unlike standard consumer photos, these assets often include clinical data figures, molecular chemical structures, and official manufacturer packaging layouts.

As provided by State Of Florida Doh Central Pharmacy, these visuals offer a comprehensive scientific overview of the product's physical and chemical identity, aiding pharmacists and researchers in product verification and study.

FDA Label Image

Label (Clopidogrel 75mg Sun Pharm)

Label (Clopidogrel 75mg Sun Pharm)
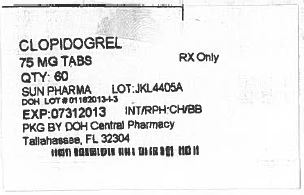
The description is "Clopidogrel 75 mg tablets, prescription only".*
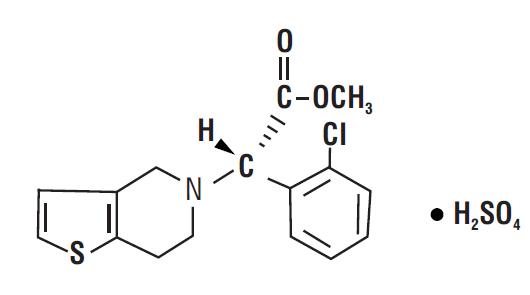
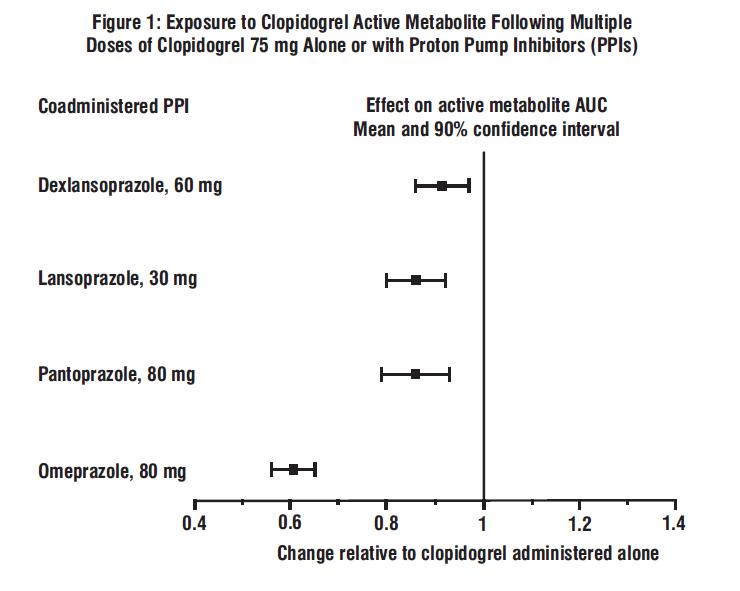
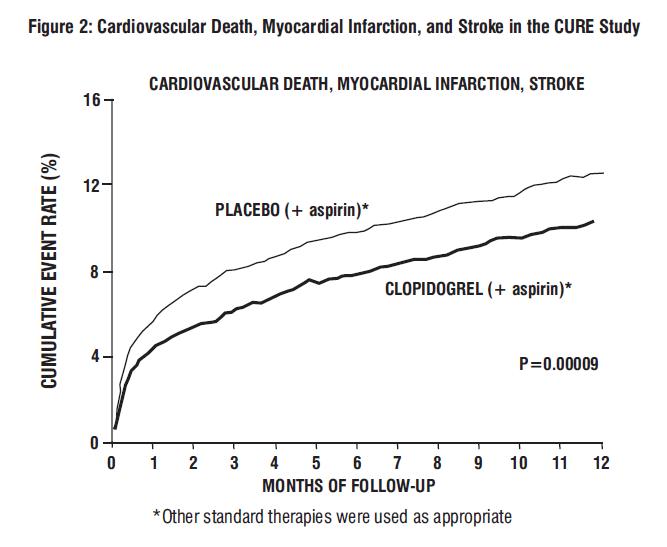
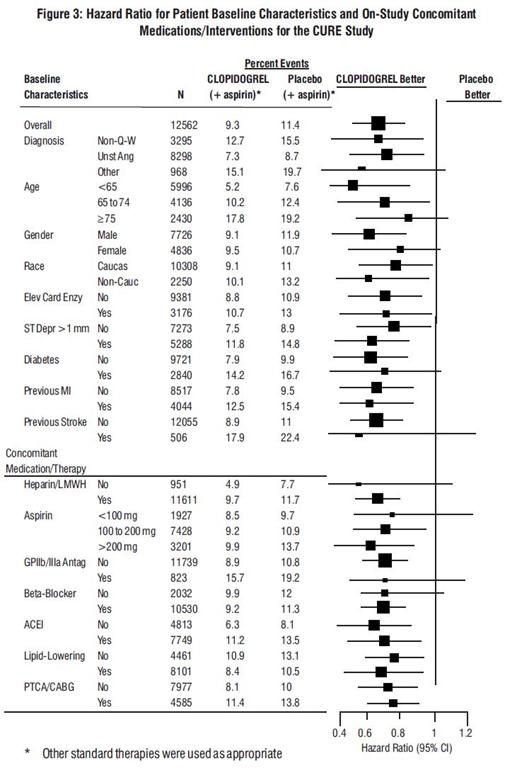
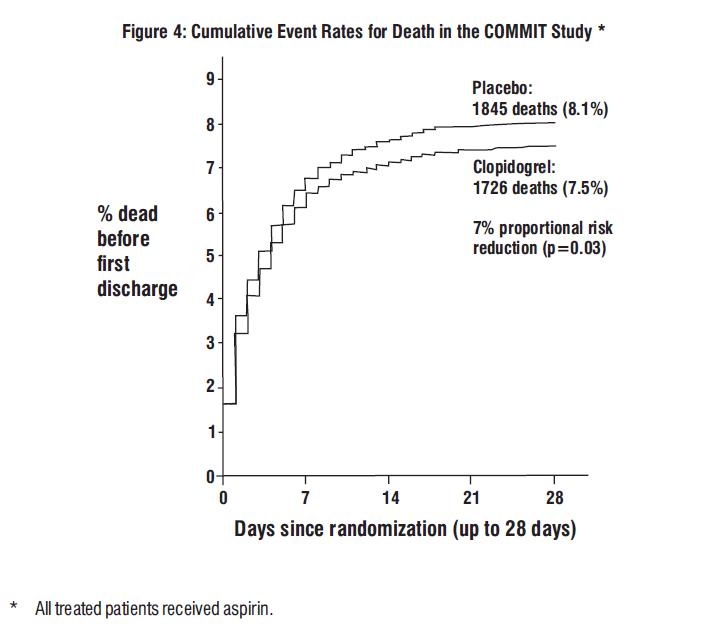
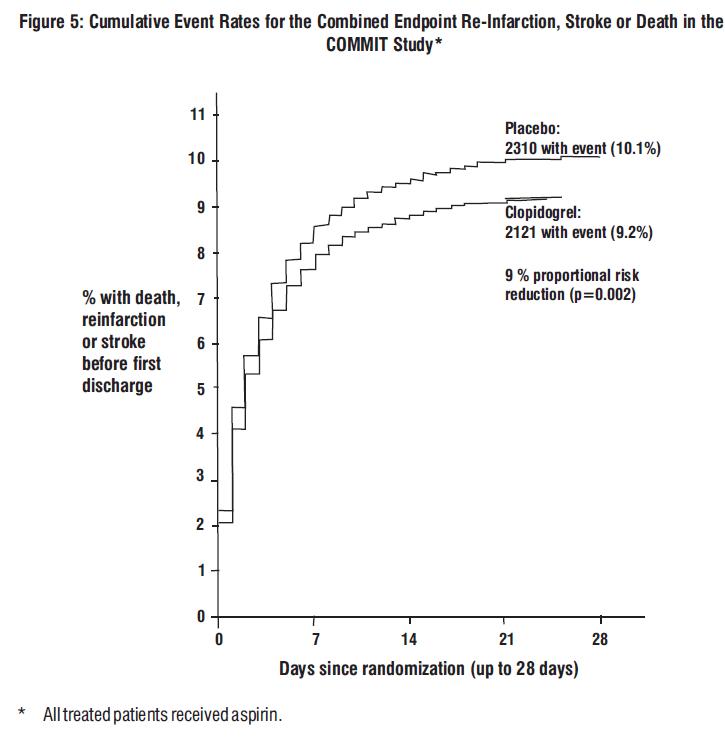
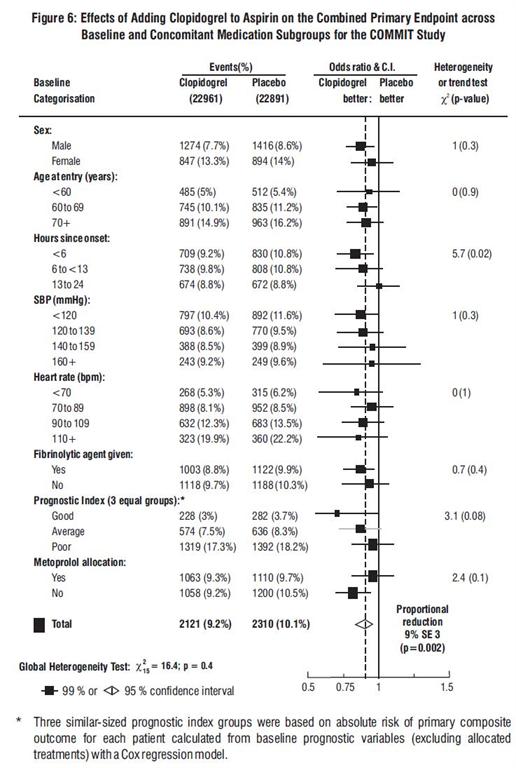
FDA Label Image

Chemical-structure (Chemical Structure)

FDA Label Image

Figure1 (Figure1)

Figure1 (Figure1)
The image shows the impact of Proton Pump Inhibitors (PPIs) on the exposure to Clopidogrel Active Metabolite after taking multiple doses of Clopidogrel 75 mg alone or with PPIs. The graph displays the mean and 90% confidence interval of the effect of different PPIs, including Dexlansoprazole, Lansoprazole, Pantoprazole, and Omeprazole, on the active metabolite AUC compared to taking Clopidogrel alone.*
FDA Label Image

Figure2 (Figure2)

Figure2 (Figure2)
This is a chart from the CURE Study showing the rates of cardiovascular death, myocardial infarction, and stroke in patients taking a placebo with aspirin versus those taking clopidogrel with aspirin. The chart shows a significantly lower event rate for those taking clopidogrel with aspirin. The study also used other standard therapies as needed.*
FDA Label Image

Figure3 (Figure3)

FDA Label Image

Figure4 (Figure4)

Figure4 (Figure4)
This is a figure from the COMMIT study showing the cumulative event rates for death before first discharge. The placebo group had 8.1% deaths and the clopidogrel group had 7.5% deaths. There was a 7% proportional risk reduction with clopidogrel (p=0.03). The x-axis shows the days since randomization up to 28 days, and all treated patients received aspirin.*
FDA Label Image

Figure5 (Figure5)

Figure5 (Figure5)
The figure 5 shows the cumulative event rates for the combined endpoint of reinfarction, stroke or death, in the COMMIT study. The study included all treated patients who received aspirin. The graph shows that the percentage with death, reinfarction or stroke before the first discharge is 7%, with Placebo: 2310Events (10.1%), and with Clopidogrel: 2121Events (9.2%). The graph also shows that there is a 9% proportional risk reduction (p=0.002) for the Clopidogrel treatment. The X-axis displays the number of days since randomization (up to 28 days).*
FDA Label Image

Figure6 (Figure6)

Figure6 (Figure6)
This is a description of statistical results from a study investigating the effects of adding Clopidogre to Aspirin on the combined primary endpoint across different subgroups for the COMMIT Study. The results are presented in table format, with percentages, odds ratios, and confidence intervals. There are subgroups based on demographic variables such as sex and age, as well as prognostic index groups based on the absolute risk of primary outcomes. There is also information on the use of fibrinolytic agents. The global Heterogeneity Test result is given.*
FDA Label Image

Figure7 (Figure7)

Figure7 (Figure7)
The figure shows the effects of adding Clopidogrel to Aspirin in different subgroups in the COMMIT study. The table displays the percentage of events for each subgroup for patients taking Clopidogrel and placebo. The odds ratio and heterogeneity test results are also presented. The subgroups evaluated include Killip class, previous MI, and infarct location. Global heterogeneity test results show a non-significant p-value.*
FDA Label Image

Figure8 (Figure8)

Figure8 (Figure8)
The text describes a graph (Figure 8) about the cumulative event rate (%) of fatal or non-fatal vascular events in a study called CAPRIE. The graph shows the results over a period of 36 months (3 years) and compares the use of aspirin and clopidogrel. There were 167 vascular events recorded.*

* These product label images have been analyzed using experimental machine learning. Please verify findings with the primary label text.