Viracept
Product Images NDC 53808-0809

5 FDA label images from State Of Florida Doh Central Pharmacy · Packaging, Regulatory Labels, and Product Appearance

Product Visual Gallery

This gallery contains 5 technical images submitted to the FDA as part of the official labeling for Viracept (NDC 53808-0809). Unlike standard consumer photos, these assets often include clinical data figures, molecular chemical structures, and official manufacturer packaging layouts.

As provided by State Of Florida Doh Central Pharmacy, these visuals offer a comprehensive scientific overview of the product's physical and chemical identity, aiding pharmacists and researchers in product verification and study.

FDA Label Image

Label Image For 625 mg (Viracept 625mg (agouron))

Label Image For 625 mg (Viracept 625mg (agouron))
The image shows a label for Viracept 625 mg tablets, quantity 30, prescription only. It is packaged by the State of Florida DOH Central Pharmacy, Tallahassee, FL 32304. The label includes lot number 0734069, expiration date 05/3110, and a barcode with UPC 36301C027703.*
FDA Label Image

Chemical Structure (Viracept 01)

Chemical Structure (Viracept 01)
Chemical structure diagram of the active ingredient in Viracept, showing its molecular components and arrangement without specific atom or bond details.*
FDA Label Image

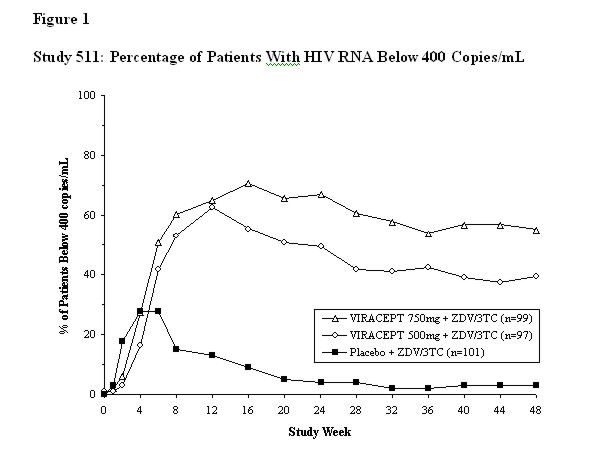
Figure 1 (Viracept 02)

Figure 1 (Viracept 02)
A line graph showing the percentage of patients with HIV RNA below 400 copies/mL over 48 study weeks. It compares three groups: VIRACEPT 750mg plus ZDV/3TC (n=99), VIRACEPT 500mg plus ZDV/3TC (n=97), and Placebo plus ZDV/3TC (n=101). The vertical axis represents the percentage of patients, and the horizontal axis represents study weeks.*
FDA Label Image

Figure 2 (Viracept 03)

Figure 2 (Viracept 03)
A line chart titled 'Study 511: Mean Change From Baseline in CD4 Cell Counts' comparing mean CD4 cell count changes over 48 study weeks. It shows three groups: VIRACEPT 750 mg + ZDV/3TC, VIRACEPT 500 mg + ZDV/3TC, and Placebo + ZDV/3TC, with respective sample sizes noted. The vertical axis represents mean change in CD4 cell count per mm³, and the horizontal axis represents study weeks from 0 to 48.*
FDA Label Image

Figure 3 (Viracept 04)

Figure 3 (Viracept 04)
A line graph comparing the percentage of patients with viral load below 400 copies/mL over a 48-week study period. It displays two treatment groups, BID and TID, with measurement points at various weeks. The y-axis represents the percentage of patients below the threshold, and the x-axis shows study weeks from 0 to 48.*

* About these descriptions: Image descriptions on this page are generated by automated AI analysis of the product label images from the manufacturer's FDA label submission (SPL). They are provided for reference only and may contain errors or omissions. Always rely on the printed label itself and the official FDA labeling, and consult a pharmacist or healthcare professional with any questions about this product.