Divalproex Sodium
Product Images NDC 53808-0940

View Photos of Packaging, Regulatory Labels, and Product Appearance

Product Visual Gallery

This gallery contains 7 technical images submitted to the FDA as part of the official labeling for Divalproex Sodium (NDC 53808-0940). Unlike standard consumer photos, these assets often include clinical data figures, molecular chemical structures, and official manufacturer packaging layouts.

As provided by State Of Florida Doh Central Pharmacy, these visuals offer a comprehensive scientific overview of the product's physical and chemical identity, aiding pharmacists and researchers in product verification and study.

FDA Label Image

Label Image For 250mg (250mg Unichem)
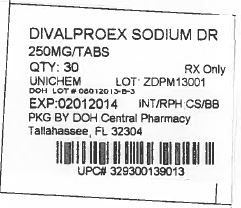
Label Image For 250mg (250mg Unichem)
Label for Divalproex Sodium 250 mg tablets, quantity 30, prescription only. The label includes lot number ZDPM13001 and an expiration date of 02/2014. Packaging by DOH Central Pharmacy, Tallahassee, FL. UPC barcode and number 329300139013 are also shown.*
FDA Label Image

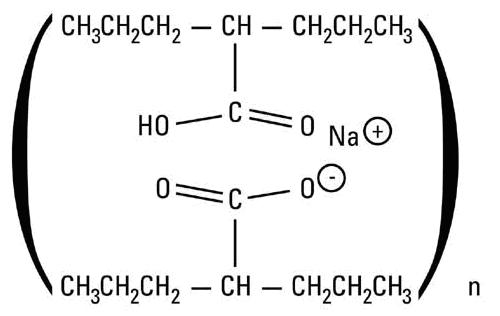
Structure Of Divalproex Sodium (Divalproextablets Figure 01)

Structure Of Divalproex Sodium (Divalproextablets Figure 01)
Chemical structure of divalproex sodium, depicting the molecular arrangement including sodium ion and associated organic groups as shown in the image.*
FDA Label Image

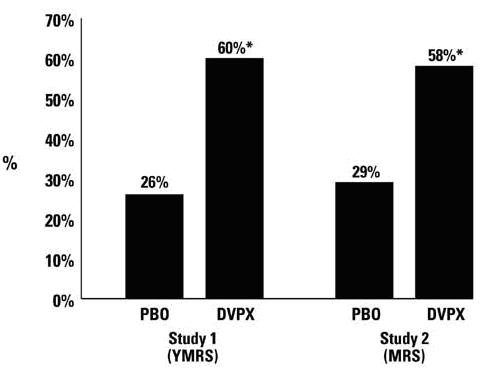
Percentages Of Patients Achieving = 30 % Reduction In Symptom Score From Baseline (Divalproextablets Figure 02)

Percentages Of Patients Achieving = 30 % Reduction In Symptom Score From Baseline (Divalproextablets Figure 02)
A bar graph comparing percentage values between placebo (PBO) and Divalproex Sodium (DVPX) groups in two studies labeled Study 1 (YMRS) and Study 2 (MRS). The percentages for DVPX are higher, with Study 1 showing 60% and Study 2 showing 58%, while respective placebo percentages are 26% and 29%. The y-axis represents percentage from 0% to 70%.*
FDA Label Image

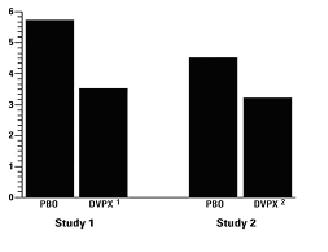
Mean 4 (week migraine rates)

Mean 4 (week migraine rates)
A bar chart comparing two studies labeled as Study 1 and Study 2, each with two bars representing 'PBO' and 'DVPX'. The vertical axis appears to measure a numeric value ranging roughly from 1 to 6. 'PBO' shows higher values than 'DVPX' in both studies.*
FDA Label Image

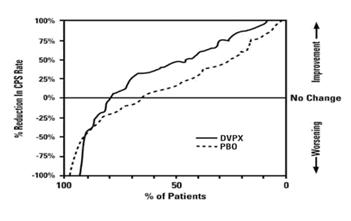
Curve For An Effective Treatment In Adjunctive Therapy Study (Divalproextablets Figure 04)

Curve For An Effective Treatment In Adjunctive Therapy Study (Divalproextablets Figure 04)
A cumulative distribution plot showing the percentage of patients on the x-axis against the percentage reduction in CRS rate on the y-axis. Two curves are displayed: a solid line for Divalproex Sodium (DVPX) and a dashed line for placebo (PBO). The y-axis indicates clinical outcome improvement or worsening.*
FDA Label Image

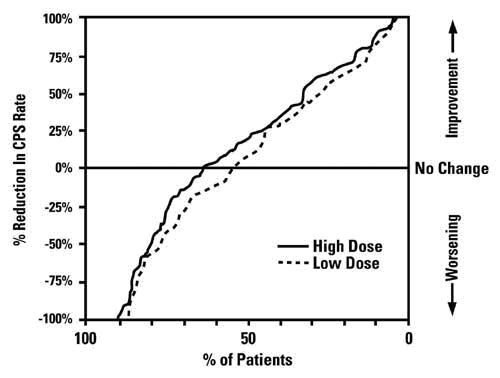
Curve For An Effective Treatment In Monotherapy Study (Divalproextablets Figure 05)

Curve For An Effective Treatment In Monotherapy Study (Divalproextablets Figure 05)
A cumulative distribution plot showing the percentage of patients against the percentage reduction in CPS rate. The graph compares two dosing regimens of Divalproex Sodium: high dose (solid line) and low dose (dashed line). Improvement is indicated above the zero line, while worsening is shown below it.*
FDA Label Image

Company Logo (Divalproextablets Figure 06)

* About these descriptions: Image descriptions on this page are generated by automated AI analysis of the product label images from the manufacturer's FDA label submission (SPL). They are provided for reference only and may contain errors or omissions. Always rely on the printed label itself and the official FDA labeling, and consult a pharmacist or healthcare professional with any questions about this product.