Losartan Potassium
Product Images NDC 53808-0978

View Photos of Packaging, Regulatory Labels, and Product Appearance

Product Visual Gallery

This gallery contains 9 technical images submitted to the FDA as part of the official labeling for Losartan Potassium (NDC 53808-0978). Unlike standard consumer photos, these assets often include clinical data figures, molecular chemical structures, and official manufacturer packaging layouts.

As provided by State Of Florida Doh Central Pharmacy, these visuals offer a comprehensive scientific overview of the product's physical and chemical identity, aiding pharmacists and researchers in product verification and study.

FDA Label Image

Label Image For 100mg (Losartan Potassium 100mg)
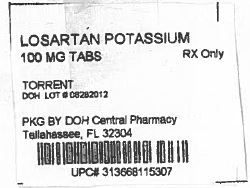
Label Image For 100mg (Losartan Potassium 100mg)
Label for Losartan Potassium 100 mg tablets, prescription only. The label indicates packaging by DOH Central Pharmacy, Tallahassee, FL 32304, including a barcode and lot number information.*
FDA Label Image

Label Image For 50mg (Losartan Potassium 50mg)

Label Image For 50mg (Losartan Potassium 50mg)
Losartan Potassium 50 mg tablets label from State of Florida DOH Central Pharmacy. The label indicates a quantity of 30 tablets, with a lot number and expiration date 01/31/2014. The label includes a barcode and the pharmacy location in Tallahassee, FL.*
FDA Label Image

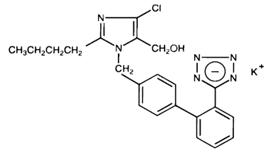
Structural Formula (Losartanpotassiumusp Figure 01)

Structural Formula (Losartanpotassiumusp Figure 01)
Chemical structure diagram of Losartan Potassium showing its molecular components including a chloride-substituted imidazole ring, a biphenyl group, a tetrazole ring, and a potassium ion (K+).*
FDA Label Image

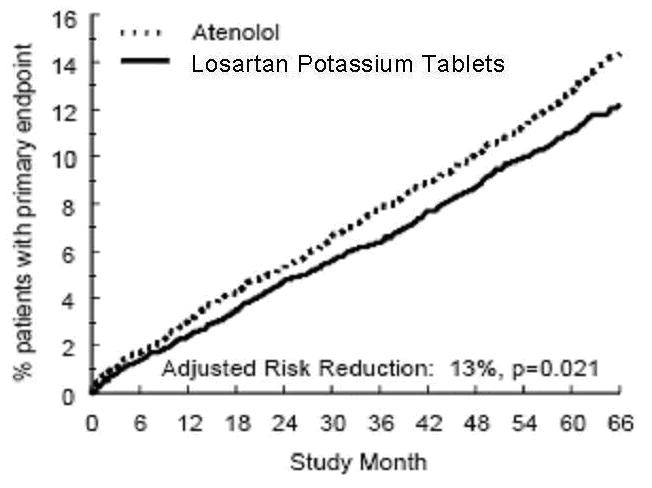
Image (Losartanpotassiumusp Figure 02)

Image (Losartanpotassiumusp Figure 02)
A line graph comparing the percentage of patients with a primary endpoint over time for Losartan Potassium Tablets and Atenolol. The x-axis represents study months from 0 to 66, and the y-axis shows the percentage of patients from 0 to 16%. The graph includes an annotation of an adjusted risk reduction of 13% with a p-value of 0.021.*
FDA Label Image

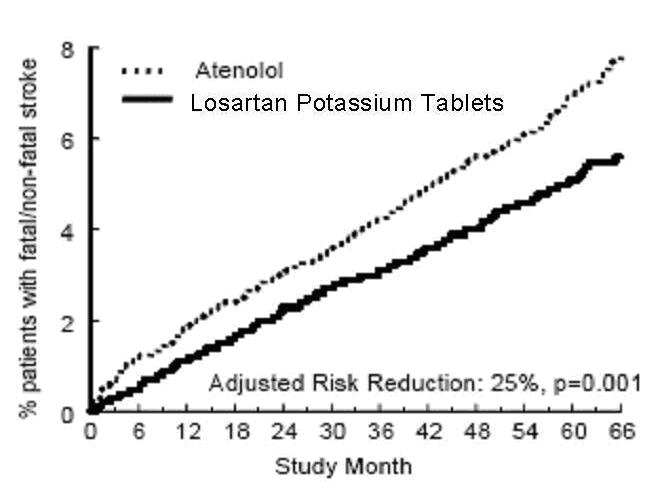
Image (Losartanpotassiumusp Figure 03)

Image (Losartanpotassiumusp Figure 03)
A line graph comparing the percentage of patients with fatal or non-fatal stroke over study months for Atenolol versus Losartan Potassium Tablets. The x-axis represents study months from 0 to 66, while the y-axis shows stroke percentage from 0 to 8%. The graph indicates a lower stroke incidence with Losartan Potassium Tablets compared to Atenolol, with an adjusted risk reduction of 25% (p=0.001).*
FDA Label Image

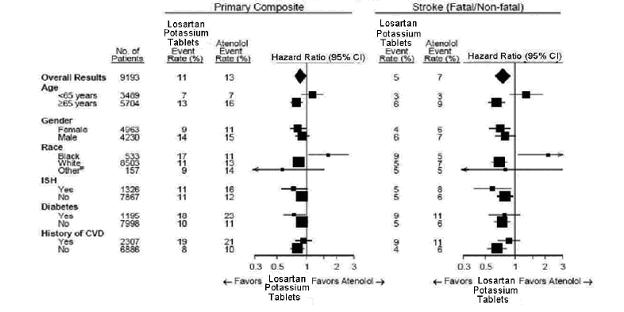
Image (Losartanpotassiumusp Figure 04)

Image (Losartanpotassiumusp Figure 04)
A comparative forest plot chart depicting hazard ratios with 95% confidence intervals for various patient subgroups treated with Losartan Potassium tablets versus Atenolol. The chart is divided into two sections: overall composite outcomes on the left and stroke (fatal/non-fatal) outcomes on the right, with subgroup categories including age, gender, race, ischemic heart disease (ISH), diabetes, and history of cardiovascular disease (CVD).*
FDA Label Image

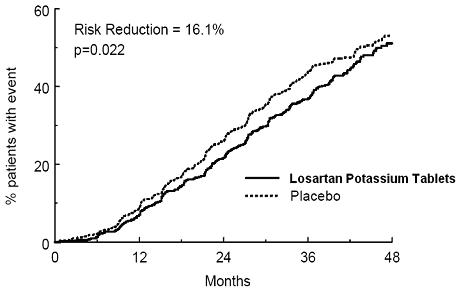
Image (Losartanpotassiumusp Figure 05)

Image (Losartanpotassiumusp Figure 05)
A line graph comparing the percentage of patients with events over 48 months between Losartan Potassium Tablets and placebo groups. The solid line represents Losartan Potassium Tablets, and the dotted line represents placebo, showing a risk reduction of 16.1% with a p-value of 0.022.*
FDA Label Image

Company Logo (Losartanpotassiumusp Figure 06)

FDA Label Image

Company Logo (Losartanpotassiumusp Figure 07)

* About these descriptions: Image descriptions on this page are generated by automated AI analysis of the product label images from the manufacturer's FDA label submission (SPL). They are provided for reference only and may contain errors or omissions. Always rely on the printed label itself and the official FDA labeling, and consult a pharmacist or healthcare professional with any questions about this product.