Product Images Levetiracetam

View Photos of Packaging, Labels & Appearance

Product Label Images

The following 8 images provide visual information about the product associated with Levetiracetam NDC 53808-1042 by State Of Florida Doh Central Pharmacy, such as packaging, labeling, and the appearance of the drug itself. This resource could be helpful for medical professionals, pharmacists, and patients seeking to verify medication information and ensure they have the correct product.

Label Image for 500mg - 500mg trigen

Label Image for 500mg - 500mg trigen

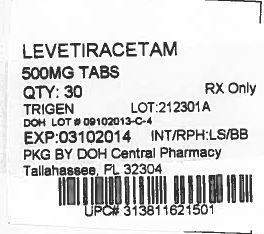
This is a prescription medication called Levetiracetam, available in 500mg tablets. The package contains 30 tablets and the Lot number is 212301A for Trigen. The medication was packaged by the Department of Health Central Pharmacy in Tallahassee, FL, and the expiration date is 03102014.*

Chemical Structure - levetiracetam 01

Chemical Structure - levetiracetam 01

Figure 1 - levetiracetam 02

Figure 1 - levetiracetam 02

The text describes a chart that displays the percentage of patients taking the drug Levetiracetam at different dosages (1000mg/day and 3000mg/day) compared to a control group taking placebo. The chart also includes percentages ranging from 0% to 45%. The last line of the text shows a value of 396%, which may be a formatting error.*

Figure 2 - levetiracetam 03

Figure 2 - levetiracetam 03

This is a chart or table displaying the percentage of patients in a study who were given a placebo (N=111) or different doses of levetiracetam (1000mg/day for N=106 or 2000mg/day for N=105). The percentages represent the proportion of patients in each group. However, the "% of Patients" title suggests that there may be more information in the table that is not visible in the text provided.*

Figure 3 - levetiracetam 04

Figure 3 - levetiracetam 04

This data table appears to show the percentage change in some variable for patients taking either a placebo or the drug Levetiracetam at a dose of 3000mg/day. However, without more context or information it is difficult to determine what the variable being measured is or the significance of the percentage changes.*

Figure 4 - levetiracetam 05

Figure 4 - levetiracetam 05

This appears to be a graph showing the percentage of patients who were given either a placebo or Levetiracetam and the percentage of patients who experienced a certain outcome. 19.6% of patients who received the placebo experienced the outcome, while 44.6% of patients who received Levetiracetam experienced the outcome. However, without additional context or information regarding the outcome, it is unclear what the significance of these percentages is.*

Figure 5 - levetiracetam 06

Figure 5 - levetiracetam 06

logo - levetiracetam 07

logo - levetiracetam 07

* The product label images have been analyzed using a combination of traditional computing and machine learning techniques. It should be noted that the descriptions provided may not be entirely accurate as they are experimental in nature. Use the information in this page at your own discretion and risk.