Terazosin
Product Images NDC 53808-1056

5 FDA label images from State Of Florida Doh Central Pharmacy · Packaging, Regulatory Labels, and Product Appearance

Product Visual Gallery

This gallery contains 5 technical images submitted to the FDA as part of the official labeling for Terazosin (NDC 53808-1056). Unlike standard consumer photos, these assets often include clinical data figures, molecular chemical structures, and official manufacturer packaging layouts.

As provided by State Of Florida Doh Central Pharmacy, these visuals offer a comprehensive scientific overview of the product's physical and chemical identity, aiding pharmacists and researchers in product verification and study.

FDA Label Image

Label Image For 1mg (Terazosin 1mg)
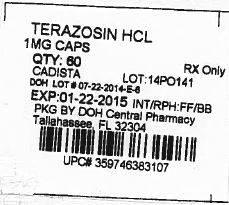
Label Image For 1mg (Terazosin 1mg)
Label for Terazosin HCL 1 mg capsules, quantity 60, prescription only. The label shows the lot number, expiration date (01-22-2015), and is packaged by DOH Central Pharmacy in Tallahassee, FL 32304. It includes a barcode and the UPC 369746383107.*
FDA Label Image

Terazosin Hydrochloride Chemical Structure (Terazosin Hydrochloride Capsules 1)

Terazosin Hydrochloride Chemical Structure (Terazosin Hydrochloride Capsules 1)
Chemical structure of Terazosin hydrochloride, depicting its molecular arrangement with functional groups, including aromatic rings, piperazine ring, and carbamate linked to an oxetane ring, along with the hydrochloride component.*
FDA Label Image

Figure 1 (Terazosin Hydrochloride Capsules 2)

Figure 1 (Terazosin Hydrochloride Capsules 2)
Two line graphs comparing Terazosin and placebo effects over three months. The left graph shows mean change in total symptom score from baseline, with Terazosin decreasing symptoms more than placebo. The right graph shows mean increase in peak flow rate (mL/sec) from baseline, with Terazosin achieving higher increases than placebo.*
FDA Label Image

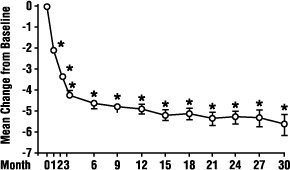
Figure 2 (Terazosin Hydrochloride Capsules 3)

Figure 2 (Terazosin Hydrochloride Capsules 3)
A line graph showing the mean change from baseline over a period of 30 months. The vertical axis measures the mean change, ranging from 0 to -7, and the horizontal axis indicates time in months. Data points are marked with circles and some are annotated with asterisks, indicating statistically significant changes at various time points.*
FDA Label Image

Figure 3 (Terazosin Hydrochloride Capsules 4)

Figure 3 (Terazosin Hydrochloride Capsules 4)
A line graph showing the mean change from baseline in mm Hg over 30 months. The y-axis represents the mean change, while the x-axis indicates months from 0 to 30. Data points are marked with asterisks indicating statistical significance at various time points.*

* About these descriptions: Image descriptions on this page are generated by automated AI analysis of the product label images from the manufacturer's FDA label submission (SPL). They are provided for reference only and may contain errors or omissions. Always rely on the printed label itself and the official FDA labeling, and consult a pharmacist or healthcare professional with any questions about this product.