Premphase
Product Images NDC 54868-3800

9 FDA label images from Physicians Total Care, Inc. · Packaging, Regulatory Labels, and Product Appearance

Product Visual Gallery

This gallery contains 9 technical images submitted to the FDA as part of the official labeling for Premphase (NDC 54868-3800). Unlike standard consumer photos, these assets often include clinical data figures, molecular chemical structures, and official manufacturer packaging layouts.

As provided by Physicians Total Care, Inc., these visuals offer a comprehensive scientific overview of the product's physical and chemical identity, aiding pharmacists and researchers in product verification and study.

FDA Label Image

No Label Available For 0.625 mg / 5 mg (No Label)

FDA Label Image

Computer_13.jpg (Computer)

FDA Label Image

Pfizer-logo-black.jpg (Pfizer Logo Black)

FDA Label Image

Phone_7.jpg (Phone)

FDA Label Image

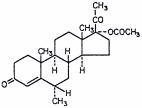
Chemical Structure (Prempro Premphase 01)

Chemical Structure (Prempro Premphase 01)
Chemical structure diagram showing the molecular configuration of the active ingredient in Premphase, as submitted in the FDA Structured Product Labeling. The structure features multiple rings and side chains typical of steroidal compounds.*
FDA Label Image

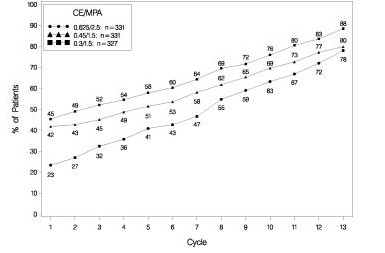
Figure 1 (Prempro Premphase 02)

Figure 1 (Prempro Premphase 02)
A line graph depicting the percentage of patients over cycles (1 to 13) in two groups labeled CE/MPA, with one group represented by open circles and the other by filled circles. The y-axis shows the percentage of patients from 0% to 100%, while the x-axis shows cycles numbered 1 through 13. The graph shows increasing patient percentages across cycles for both groups.*
FDA Label Image

Figure 2 (Prempro Premphase 03)

Figure 2 (Prempro Premphase 03)
Line graph showing the percentage of patients over 13 cycles for three different groups with varying doses labeled as CE/MPA 0.625/2.5, 0.45/1.5, and 0.3/1.5, illustrating a trend of increasing patient percentages with each cycle.*
FDA Label Image

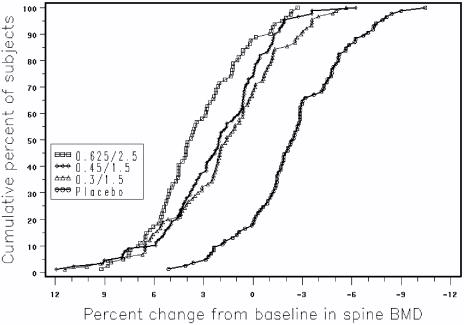
Figure 3 (Prempro Premphase 04)

Figure 3 (Prempro Premphase 04)
A cumulative percent of subjects chart plotting percent change from baseline in spine bone mineral density (BMD) on the x-axis against cumulative percent of subjects on the y-axis. The graph compares four groups labeled with different dosage combinations and placebo, showing the distribution of BMD changes over time.*
FDA Label Image

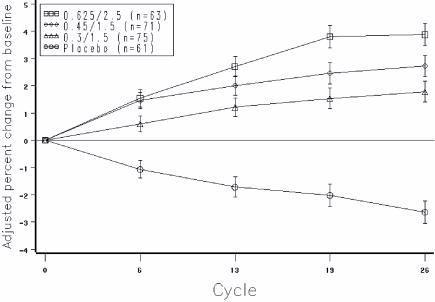
Figure 4 (Prempro Premphase 05)

Figure 4 (Prempro Premphase 05)
A line graph showing adjusted percent change from baseline over multiple cycles for four groups: three dose groups labeled with ratios (0.625/2.5, 0.45/1.5, 0.3/1.5) and a placebo group. The x-axis represents cycle number, and the y-axis indicates adjusted percent change. Data points include error bars and sample sizes for each group.*

* About these descriptions: Image descriptions on this page are generated by automated AI analysis of the product label images from the manufacturer's FDA label submission (SPL). They are provided for reference only and may contain errors or omissions. Always rely on the printed label itself and the official FDA labeling, and consult a pharmacist or healthcare professional with any questions about this product.