Femara
Product Images NDC 54868-4151

View Photos of Packaging, Regulatory Labels, and Product Appearance

Product Visual Gallery

This gallery contains 7 technical images submitted to the FDA as part of the official labeling for Femara (NDC 54868-4151). Unlike standard consumer photos, these assets often include clinical data figures, molecular chemical structures, and official manufacturer packaging layouts.

As provided by Physicians Total Care, Inc., these visuals offer a comprehensive scientific overview of the product's physical and chemical identity, aiding pharmacists and researchers in product verification and study.

FDA Label Image

Image Of Package Label (4151)
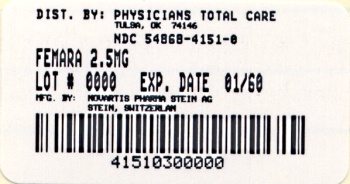
Image Of Package Label (4151)
Packaging label for Femara 2.5 mg showing the labeler as Physicians Total Care, Inc. The label includes lot number and expiration date fields, a barcode, and mentions manufacturing by Novartis Pharma Stein AG in Switzerland.*
FDA Label Image

Letrozole Structural Formula (Femara 01)

Letrozole Structural Formula (Femara 01)
Chemical structure diagram of the active ingredient in Femara, showing a dibenzonitrile moiety linked to a triazole ring. The image illustrates the molecular arrangement of the compound's atoms and bonds relevant to this drug product.*
FDA Label Image

Figure 1 Disease-free Survival (median Follow-up 73 Months, Itt Approach) (Femara 02)

Figure 1  Disease-free Survival (median Follow-up 73 Months, Itt Approach) (Femara 02)
A line graph comparing the proportion disease-free over 60 months between two treatments: tamoxifen and letrozole. The x-axis represents time in months, and the y-axis shows the proportion of patients disease-free. Two lines depict the survival curves for tamoxifen (dashed) and letrozole (solid). Sample sizes at various months are indicated below the x-axis.*
FDA Label Image

Figure 2 Kaplan-meier Estimates Of Time To Progression (tamoxifen Study) (Femara 03)

Figure 2  Kaplan-meier Estimates Of Time To Progression (tamoxifen Study) (Femara 03)
A line chart comparing progression-free status over time (in months) between Femara 2.5 mg and tamoxifen 20 mg. The vertical axis represents progression-free proportion from 0.0 to 1.0, and the horizontal axis shows time from 0 to 60 months. Femara shows higher progression-free rates compared to tamoxifen across the timeline.*
FDA Label Image

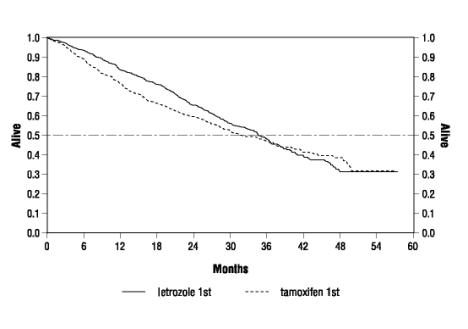
Figure 3 Survival By Randomized Treatment Arm (Femara 04)

Figure 3  Survival By Randomized Treatment Arm (Femara 04)
A survival curve chart comparing two treatments, letrozole and tamoxifen, over a period of months. The Y-axis represents the proportion of subjects alive, while the X-axis represents time in months, showing survival trends for letrozole first and tamoxifen first groups.*
FDA Label Image

Figure 4 Kaplan-meier Estimates Of Time To Progression (megestrol Acetate Study) (Femara 05)

Figure 4  Kaplan-meier Estimates Of Time To Progression (megestrol Acetate Study) (Femara 05)
A Kaplan-Meier survival curve graph showing time to disease progression in days for three treatment groups: Femara 0.5 mg, Femara 2.5 mg, and MA, depicting the progression-free survival over time.*
FDA Label Image

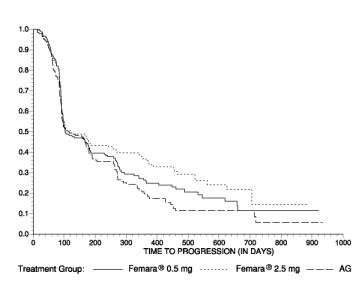
Figure 5 Kaplan-meier Estimates Of Time To Progression (aminoglutethimide Study) (Femara 06)

Figure 5  Kaplan-meier Estimates Of Time To Progression (aminoglutethimide Study) (Femara 06)
A Kaplan-Meier curve graph displaying time to progression for treatment groups including Femara at 0.5 mg, Femara at 2.5 mg, and a comparator group (AG). The y-axis shows progression-free survival probability, and the x-axis represents time to progression in days up to 1000.*

* About these descriptions: Image descriptions on this page are generated by automated AI analysis of the product label images from the manufacturer's FDA label submission (SPL). They are provided for reference only and may contain errors or omissions. Always rely on the printed label itself and the official FDA labeling, and consult a pharmacist or healthcare professional with any questions about this product.