Levaquin
Product Images NDC 54868-4175

6 FDA label images from Physicians Total Care, Inc. · Packaging, Regulatory Labels, and Product Appearance

Product Visual Gallery

This gallery contains 6 technical images submitted to the FDA as part of the official labeling for Levaquin (NDC 54868-4175). Unlike standard consumer photos, these assets often include clinical data figures, molecular chemical structures, and official manufacturer packaging layouts.

As provided by Physicians Total Care, Inc., these visuals offer a comprehensive scientific overview of the product's physical and chemical identity, aiding pharmacists and researchers in product verification and study.

FDA Label Image

Principal Display Panel (500 mg Tablet)
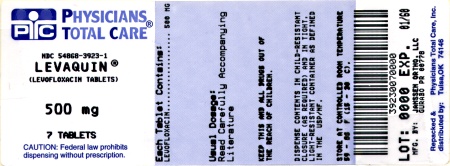
Principal Display Panel (500 mg Tablet)
Packaging label for LEVAQUIN 500 mg tablets by Physicians Total Care, Inc. The label indicates 7 tablets per package and specifies the active ingredient as levofloxacin. It includes cautionary statements about prescription dispensing, the NDC number 54868-3923-1, and a barcode with additional regulatory text.*
FDA Label Image

Principal Display Panel (250 mg Tablet)

Principal Display Panel (250 mg Tablet)
LEVAQUIN 250 mg tablets packaging label by Physicians Total Care, Inc. Contains 10 tablets of levofloxacin. The label features dosage strength, quantity, caution statement about prescription dispensing, and barcodes along with manufacturing and expiration details.*
FDA Label Image

Principal Display Panel (750 mg Tablet)

Principal Display Panel (750 mg Tablet)
LEVAQUIN 750 mg tablet bottle label by Physicians Total Care, Inc. The label indicates the active ingredient as levofloxacin and states that the bottle contains 10 tablets. It includes usage cautions, storage instructions, lot number, expiration date, and barcodes typical for pharmaceutical packaging.*
FDA Label Image

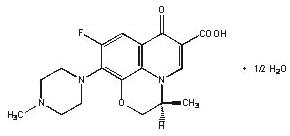
Chemical Structure (Levaquin 01)

Chemical Structure (Levaquin 01)
Chemical structure of LEVAQUIN showing its molecular formula with fluorine, nitrogen, oxygen, hydrogen atoms, and water of hydration (1/2 H2O) as part of the structure.*
FDA Label Image

Figure 2 (Levaquin 02)

Figure 2 (Levaquin 02)
This figure is a plasma concentration versus time graph comparing LEVAQUIN 750 mg tablets taken orally to a 750 mg intravenous infusion over 90 minutes. The y-axis represents plasma concentration in micrograms per milliliter (µg/mL), and the x-axis shows time in hours. The graph illustrates concentration changes up to 36 hours post-dose.*
FDA Label Image

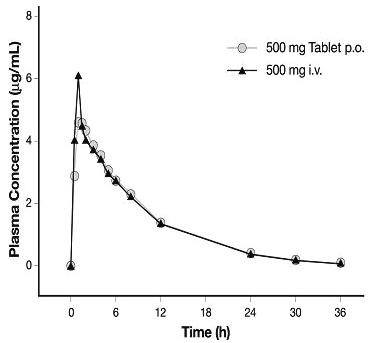
Figure 3 (Levaquin 03)

Figure 3 (Levaquin 03)
A pharmacokinetic graph showing plasma concentration (µg/mL) versus time (hours) for LEVAQUIN 500 mg administered orally (p.o.) and intravenously (i.v.). The graph compares plasma concentration over a 36-hour period, illustrating similar concentration profiles for both administration routes.*

* About these descriptions: Image descriptions on this page are generated by automated AI analysis of the product label images from the manufacturer's FDA label submission (SPL). They are provided for reference only and may contain errors or omissions. Always rely on the printed label itself and the official FDA labeling, and consult a pharmacist or healthcare professional with any questions about this product.