Aciphex
Product Images NDC 54868-4185

View Photos of Packaging, Regulatory Labels, and Product Appearance

Product Visual Gallery

This gallery contains 6 technical images submitted to the FDA as part of the official labeling for Aciphex (NDC 54868-4185). Unlike standard consumer photos, these assets often include clinical data figures, molecular chemical structures, and official manufacturer packaging layouts.

As provided by Physicians Total Care, Inc., these visuals offer a comprehensive scientific overview of the product's physical and chemical identity, aiding pharmacists and researchers in product verification and study.

FDA Label Image

Image Of 20 mg Package Label (4185)
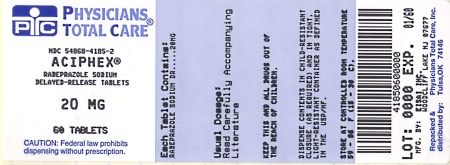
Image Of 20 mg Package Label (4185)
Label for Aciphex 20 mg delayed-release tablets by Physicians Total Care, Inc., NDC 54868-4185. The label states 60 tablets per bottle and contains instructions, cautions including a federal law prohibition on dispensing without prescription, and storage conditions to keep the medication out of reach of children and store below 86°F.*
FDA Label Image

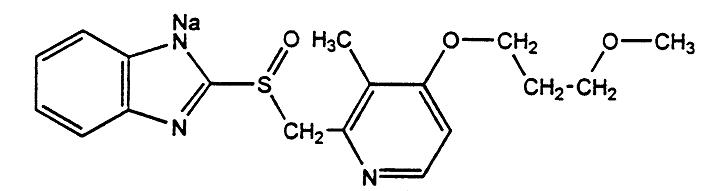
Image Of Chemical Structure (Chemical Structure)

Image Of Chemical Structure (Chemical Structure)
Chemical structure of the active ingredient in Aciphex, showing a complex molecule with a benzene ring, a sulfone group, and pyridine moieties.*
FDA Label Image

Image Of Graph 1 (Figure 1)

Image Of Graph 1 (Figure 1)
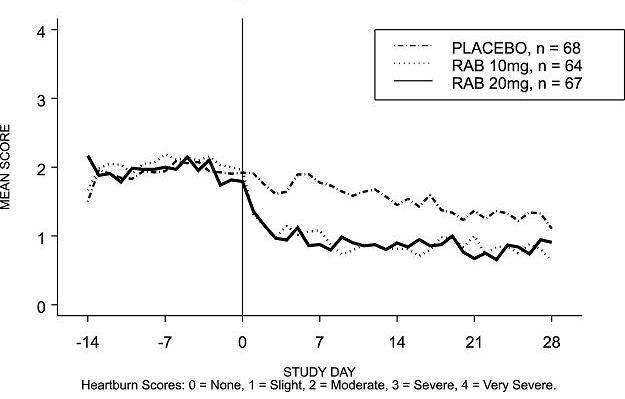
A line graph depicting mean heartburn scores over a 28-day study period for three groups: placebo, rabeprazole 10 mg, and rabeprazole 20 mg. The vertical axis shows mean scores from 0 (none) to 4 (very severe), and the horizontal axis shows study days ranging from -14 to 28. Scores decrease notably after study day 0 for the rabeprazole groups compared to placebo.*
FDA Label Image

Image Of Graph 2 (Figure 2)

Image Of Graph 2 (Figure 2)
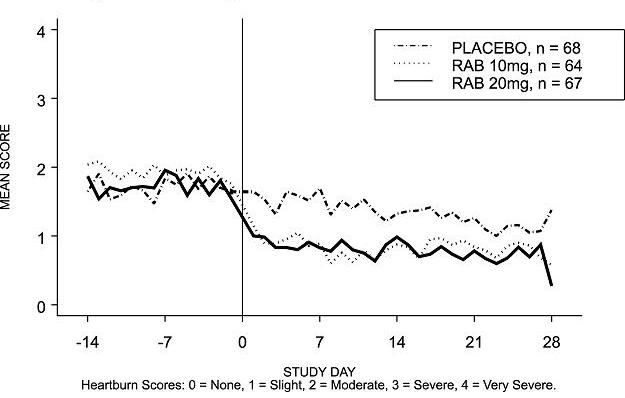
A line graph showing heartburn mean scores over a 28-day study period for three groups: placebo, RAB 10 mg, and RAB 20 mg. The x-axis represents study days from -14 to 28, and the y-axis shows mean heartburn severity scores from 0 (none) to 4 (very severe). The graph compares severity score trends among the groups during and after treatment initiation.*
FDA Label Image

Image Of Graph 3 (Figure 3)

Image Of Graph 3 (Figure 3)
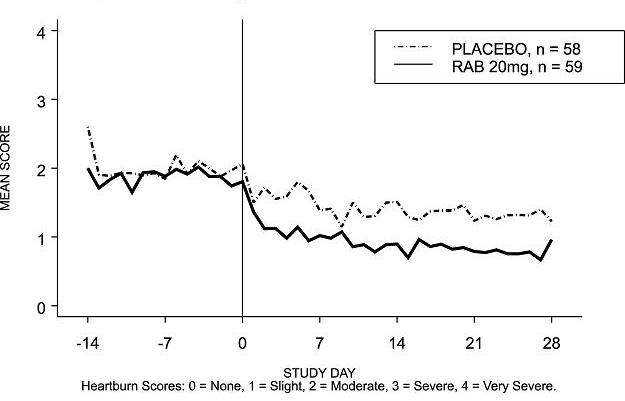
A line graph showing mean heartburn scores over a 28-day study period comparing a placebo group and a group receiving RAB 20mg. The x-axis represents study days from -14 to 28, and the y-axis represents mean heartburn scores from 0 (None) to 4 (Very Severe). The graph reveals a notable decrease in heartburn scores after day 0 for the RAB 20mg group compared to the placebo group.*
FDA Label Image

Image Of Graph 4 (Figure 4)

Image Of Graph 4 (Figure 4)
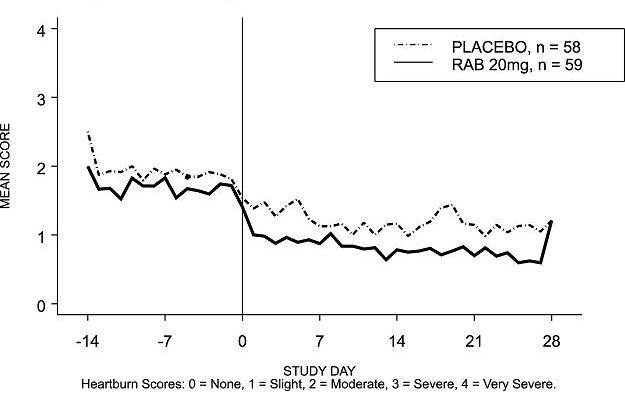
A line graph comparing mean heartburn scores over 28 study days for two groups: a placebo group (n=58) and a group receiving 20mg RAB (n=59). The y-axis shows heartburn scores from 0 (None) to 4 (Very Severe), and the x-axis shows study days, with day 0 marking the treatment start. The RAB group generally shows lower heartburn scores than the placebo group after treatment begins.*

* About these descriptions: Image descriptions on this page are generated by automated AI analysis of the product label images from the manufacturer's FDA label submission (SPL). They are provided for reference only and may contain errors or omissions. Always rely on the printed label itself and the official FDA labeling, and consult a pharmacist or healthcare professional with any questions about this product.